YouTube Data Usage Calculator
Estimate monthly YouTube streaming, Shorts, live viewing, upload traffic, mobile share, and data-cap impact for every screen on your home network.
Calculation Breakdown
The network card figures are planning cues: the calculator estimates WAN data volume, while the comparison grid flags local-network limits that can make YouTube buffer even when the data cap is fine.
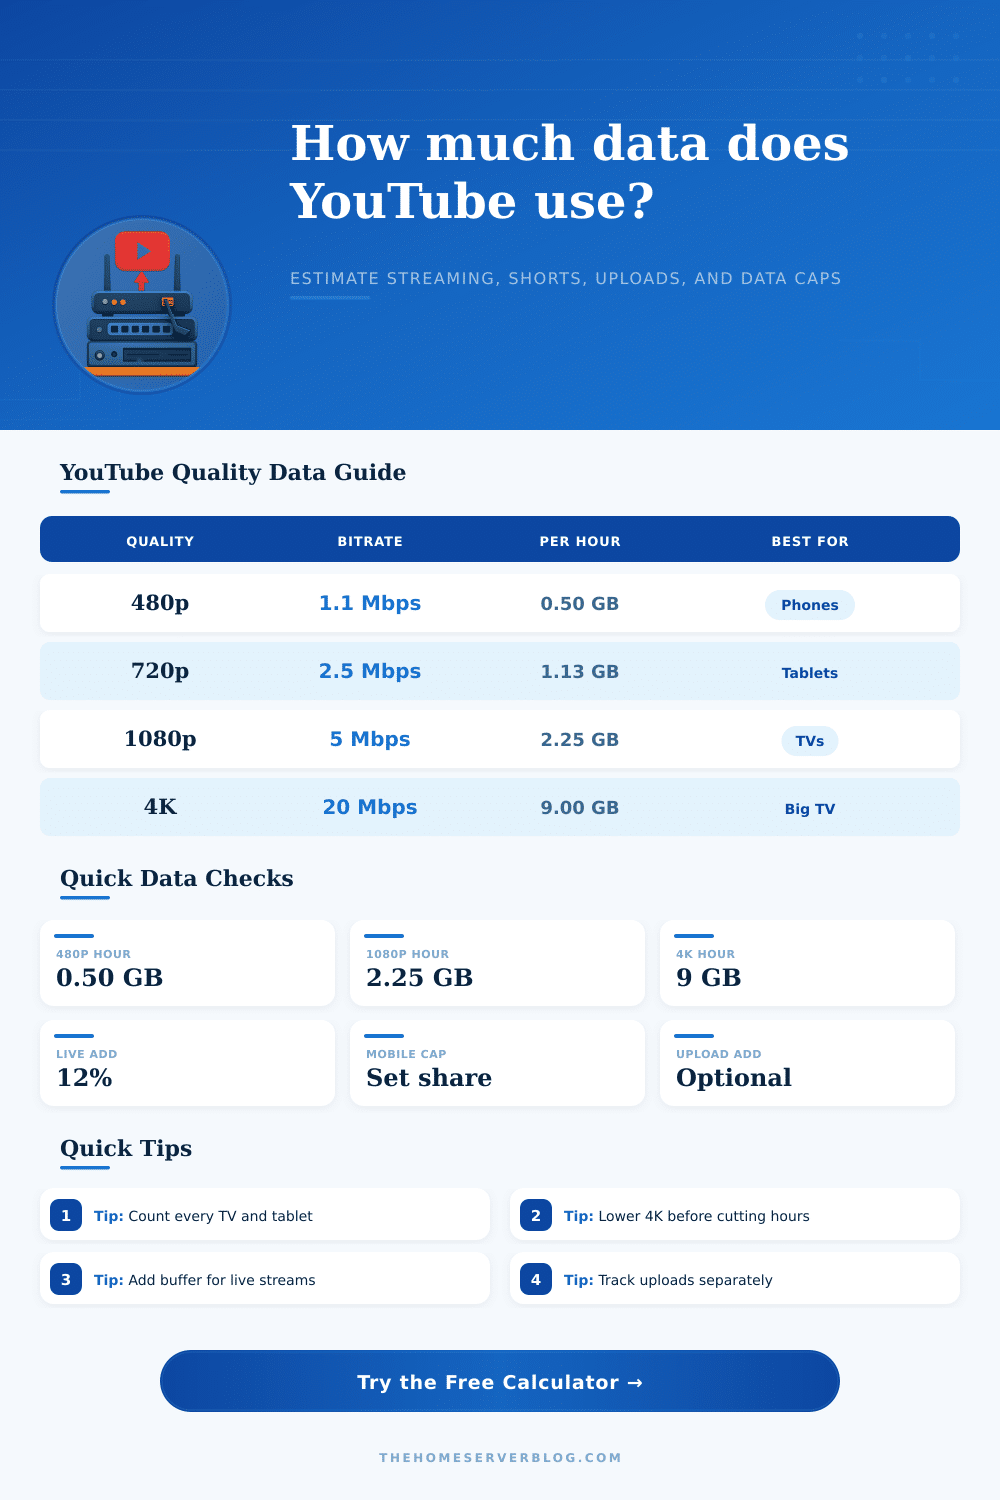
| Quality | Typical Bitrate | Approx GB Per Hour | Good Fit |
|---|---|---|---|
| 144p | 0.12 Mbps | 0.05 GB | Audio-heavy viewing on weak mobile links |
| 240p | 0.30 Mbps | 0.14 GB | Small phone screens and emergency hotspot use |
| 360p | 0.70 Mbps | 0.32 GB | Basic mobile video with modest detail |
| 480p | 1.10 Mbps | 0.50 GB | Standard definition lessons and music videos |
| 720p | 2.50 Mbps | 1.13 GB | Tablets, laptops, and smaller TVs |
| 1080p | 5.00 Mbps | 2.25 GB | Main TVs and desktop monitors |
| 1440p | 10.00 Mbps | 4.50 GB | Large monitors and high-detail channels |
| 2160p 4K | 20.00 Mbps | 9.00 GB | 4K televisions and cinematic viewing |
| 4320p 8K | 50.00 Mbps | 22.50 GB | Specialty 8K displays and demos |
| Network Setup | Useful Capacity | YouTube Planning Note | Best Use |
|---|---|---|---|
| 2.4 GHz Wi-Fi 4 | 20-80 Mbps real | Good for SD or one HD screen when signal is clean | Phones far from router |
| 5 GHz Wi-Fi 5 | 100-400 Mbps real | Comfortable for several 1080p or one 4K stream | Living room devices |
| Wi-Fi 6 mesh node | 150-700 Mbps real | Backhaul quality matters more than the app bitrate | Whole-home streaming |
| Fast Ethernet | 94 Mbps usable | Enough for multiple HD streams, tight for many 4K TVs | Older smart TVs |
| Gigabit Ethernet | 940 Mbps usable | Local link is rarely the YouTube bottleneck | TVs, consoles, NAS |
| Mobile hotspot | Variable | Data cap is usually the limiting factor | Travel and backup WAN |
| Scenario | Assumption | Approx Monthly Data | Cap Impact |
|---|---|---|---|
| One phone at 480p | 1 hour daily | 15 GB | Light on a 1 TB plan |
| Student tablet at 720p | 2 hours daily | 68 GB | Noticeable on small caps |
| Family 1080p evening | 3 screens, 2 hours daily | 405 GB | Large share of 1 TB |
| 4K TV habit | 1 screen, 3 hours daily | 810 GB | Can dominate a 1 TB cap |
| Creator uploads | 120 minutes 4K export | 54 GB upload | Adds to viewing traffic |
| Weekend live events | 8 live HD hours | 50 GB | Spikes daily average |
| Item | Formula Or Value | Why It Matters | Calculator Use |
|---|---|---|---|
| Streaming volume | Mbps × seconds ÷ 8 | Converts megabits to megabytes | Main viewing data |
| Decimal GB | 1 GB = 1000 MB | Most ISPs meter decimal gigabytes | Monthly total |
| Playback speed | Clock hours × speed | 2x viewing plays twice the content per hour | Effective content hours |
| Live overhead | 8-12% add | Live segments and buffer refresh add traffic | Playback mode factor |
| TCP/IP overhead | 5-20% buffer | Accounts for retransmits, VPN, and bitrate swings | Safety dropdown |
| Peak bandwidth | Bitrate × screens | Prevents buffering during simultaneous streams | Mbps result card |
When people considers how much data they are using on YouTube, many do so only when they recieve their monthly bill for there internet service provider. For many households, the bill for that internet service is higher then they had expected. The primary reason for the high cost of data for individual’s monthly bill is not the number of hours they spends viewing YouTube videos, but instead the number of device in the household, the quality of the YouTube video settings, and the number of YouTube tabs that is continuously playing videos in the background.
For example, a single stream of a 1080p YouTube video requires the user to downloading 2.25 gigabytes of data each hour. If the number of screens that are playing YouTube videos are high, and if the number of days that those screens are continuously on is high, the total amount of data that is downloaded from YouTube can become very high. The calculator that is provide on this page will allow the user to input the number of devices, the quality of the videos, and a variety of other factor.
How Much Data Does YouTube Use?
Based off the information that you enter into this calculator, it will be able to perform the math for you to determine the amount of data that you will use on YouTube. The calculator will provide you with a number, but will not explain why your household may use more data from YouTube than another household. The playback speed of the videos that you view on YouTube will also impact the amount of data that you use while watching YouTube videos.
If you set your playing speed to 1.5 times the normal speed, you will play more minute of YouTube videos in a given hour. While the calculator accounts for different speed of YouTube videos, you will have to make a decision as to whether you need the increased playback speed for your viewing needs. If you use YouTube videos as background noise in the house while performing other task, setting the playback speed to 1.5 times the normal speed will result in the user using more data from YouTube.
However, if you use YouTube videos to help you study for class or tests, using 1.5 times the normal speed may prove to be a helpful tool. In addition to watching regular length video on YouTube, many individuals also enjoy YouTube Shorts. For many individuals, YouTube Shorts use less data than other videos on YouTube because of the shorter length of the videos.
However, because the screen constantly switches between different YouTube Shorts videos, there are data issue related to adaptive bitrates of the videos. Thus, playing a few dozen minutes of YouTube Shorts videos can use the same amount of data as watching a long-form YouTube video. In addition to YouTube Shorts, other factors that contribute to the amount of data that an individual may use on YouTube is live YouTube stream.
Because live YouTube streams require the video to buffer and change segments while being played, more data is used for these live videos. Thus, to account for live YouTube streams, the calculator provides a mode selector to determine how many minutes of live YouTube videos is watched each day. Additionally, the amount of data that is used for uploading videos to YouTube can be greater than the amount of data that is used for watching videos on YouTube.
For example, uploading a 4K YouTube video can contain more data than several hour of watching 1080p YouTube videos. Thus, the calculator allows individuals to enter the number of minutes that they spend uploading YouTube videos each day, as well as the number of uploading profile that they have in their household. In addition to the data that is used for YouTube videos that are watched and uploaded, another variable related to the data that is used is the mobile data that is used while watching YouTube videos on a mobile device.
The percentage field in the calculator allows individuals to split their YouTube data use between their home internet and mobile data. Thus, if they wish to watch YouTube videos on their mobile device, the percentage can be used to decide if changing their quality settings on that mobile device are necessary. The concept and number of data that is used for YouTube videos become even more important when considering the data caps that many internet plan have.
Data caps limit the amount of data that an individual can use each month. If an individual does not have a data cap on their internet plan, the calculator will help them understand the amount of data that they will use on YouTube and if their home Wi-Fi can handle such high data requirement. However, if they do have a data cap on their internet internet plan, the calculator will inform them of how close they are to reach the amount of data that their internet plan allows them to use each month.
For instance, dropping one television from 4K to 1080p resolution can save the household more data than shortening a few of their mobile YouTube viewing session. Additionally, the reference table that are included in the article help individuals understand why 720p videos use half the amount of data as 1080p videos, but 4K videos use more data than 1080p videos. Finally, the goal of creating this YouTube data calculator is to allow individuals to have more intentional control over their YouTube viewing habits, as the calculator makes decision for them that would otherwise require the performance of manual calculations to determine those answer.