HomeServerBlog 5G NR planning tool
5G NR ARFCN Calculator
Convert NR-ARFCN to RF reference frequency, test FR1 or FR2 band limits, estimate channel grid occupancy, and check raster, Point A, carrier aggregation, and guard-band planning values.
📶Band presets
⚙ARFCN and carrier inputs
Calculation breakdown
Planning status
📊Frequency, raster, band, and guard cards
Uses center frequency, RB width, occupied grid, and the configured Point A offset.
Reverse conversion from target center frequency on the appropriate global raster tier.
Estimated from maximum RB count, 12 subcarriers per RB, and selected SCS.
Approximate multi-carrier center-to-center span for contiguous planning.
📚NR-ARFCN reference tables
| Global frequency range | Delta FGlobal | FREF offset | NREF range |
|---|---|---|---|
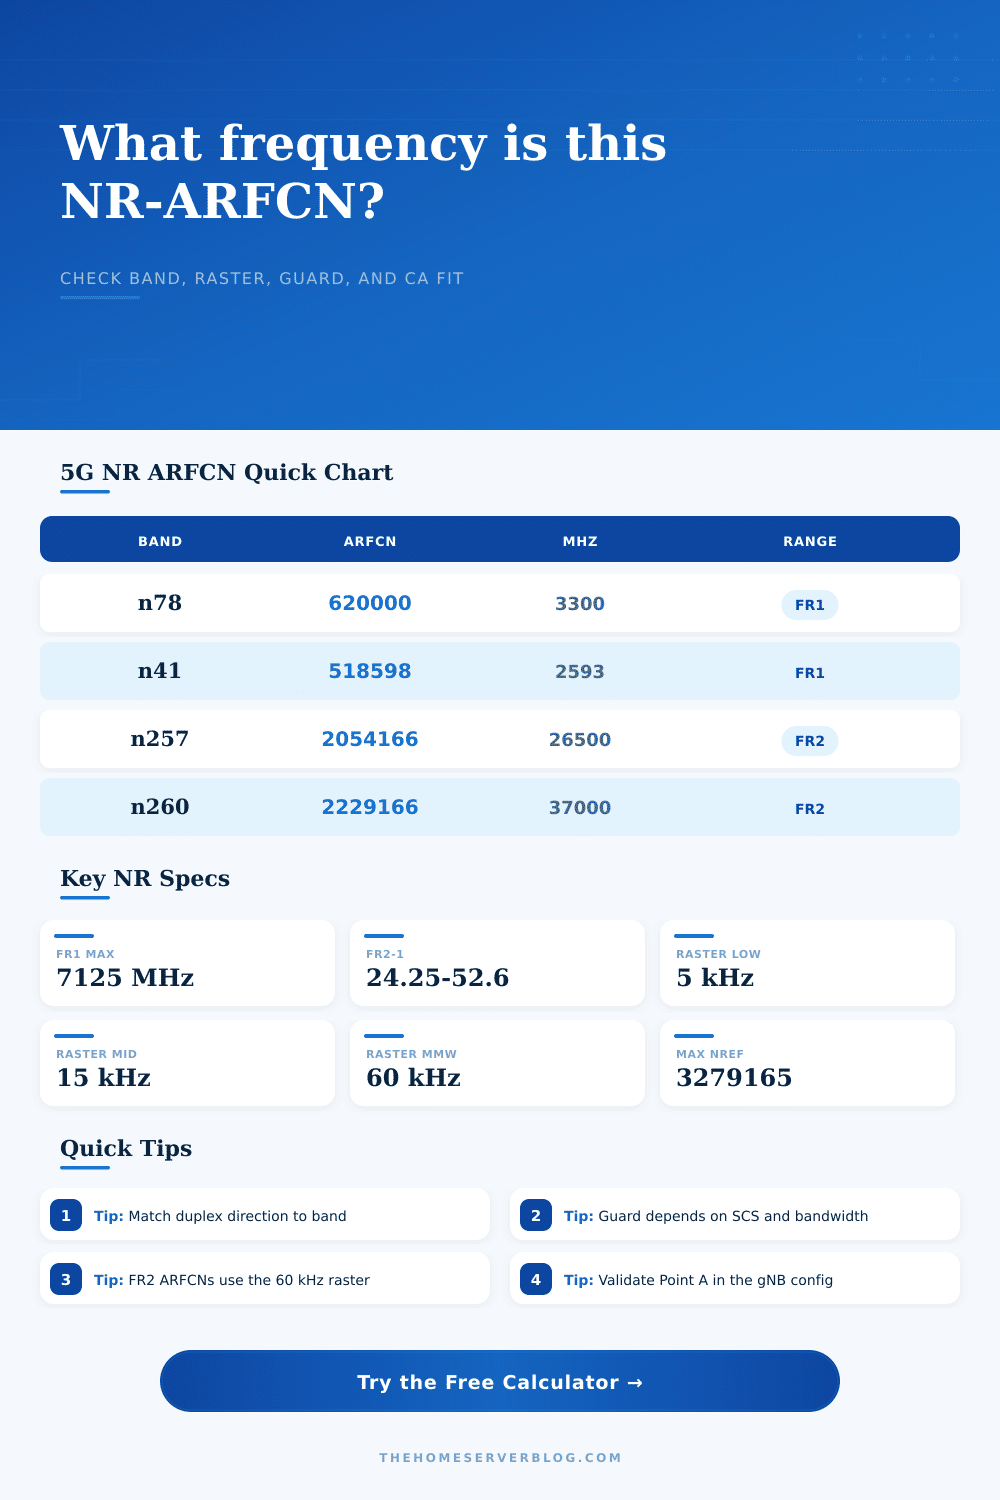
| 0 to 3000 MHz | 5 kHz | 0 MHz | 0 to 599999 |
| 3000 to 24250 MHz | 15 kHz | 3000 MHz | 600000 to 2016666 |
| 24250.08 to 100000 MHz | 60 kHz | 24250.08 MHz | 2016667 to 3279165 |
| Band | Direction | Frequency range | NR-ARFCN range |
|---|---|---|---|
| n1 | Downlink | 2110 to 2170 MHz | 422000 to 434000 |
| n1 | Uplink | 1920 to 1980 MHz | 384000 to 396000 |
| n3 | Downlink | 1805 to 1880 MHz | 361000 to 376000 |
| n28 | Downlink | 758 to 803 MHz | 151600 to 160600 |
| n41 | TDD | 2496 to 2690 MHz | 499200 to 538000 |
| n78 | TDD | 3300 to 3800 MHz | 620000 to 653333 |
| FR2 band | Operating range | NR-ARFCN range | Typical lab use |
|---|---|---|---|
| n257 | 26500 to 29500 MHz | 2054166 to 2104165 | 28 GHz test carrier and FWA trials. |
| n258 | 24250.08 to 27500 MHz | 2016667 to 2070832 | 26 GHz mmWave lab and regional deployments. |
| n260 | 37000 to 40000 MHz | 2229166 to 2279165 | 39 GHz high-band mmWave work. |
| n261 | 27500 to 28350 MHz | 2070833 to 2084999 | 28 GHz subset used in some markets. |
| SCS | Common bandwidths | Example NRB | Planning note |
|---|---|---|---|
| 15 kHz FR1 | 5 to 50 MHz | 25 to 270 RB | Common lower-band numerology with smaller channels. |
| 30 kHz FR1 | 5 to 100 MHz | 11 to 273 RB | Common mid-band 5G choice for n77 and n78. |
| 60 kHz FR1/FR2 | 10 to 200 MHz | 11 to 264 RB | Useful near FR1 upper bands and FR2 planning. |
| 120 kHz FR2 | 50 to 400 MHz | 32 to 264 RB | Typical mmWave numerology for wider carriers. |
🖧FR1 and FR2 grid
| Range | Frequency span | Common SCS | Home lab design note |
|---|---|---|---|
| FR1 low/mid | 410 to 7125 MHz operating bands | 15, 30, or 60 kHz | Private 5G, CBRS-style labs, indoor small cells, and shared-spectrum trials usually live here. |
| FR2-1 | 24250 to 52600 MHz | 60 or 120 kHz | mmWave needs tighter RF planning, short paths, and careful beam or antenna alignment. |
| FR2-2 | 52600 to 71000 MHz | 120 or 480 kHz in newer work | Use as a planning reminder only unless your equipment explicitly supports the band. |
| Global raster | 0 to 100000 MHz reference formula | 5, 15, or 60 kHz | NR-ARFCN is a reference-frequency number; the selected band still controls whether it is usable. |
💡5G NR ARFCN tips
Building out a private 5G network takes careful planning, including the proper frequencies. Got the spectrum license? Got the radios? Got a vague sense of where the coverage needs to go?
On paper it’s often the channel number that appears fine, yet the radio doesn’t sync. It is typically not a hardware problem, but an arithmetic one. The 5G nr arfcn calculator turns the abstract channel number into the underlying RF reference frequency. It then validates whether the selected channel falls within the legal band. It also makes sure you have enough guard margin for regulatory compliance. It goes from guesswork to exact engineering verification.
Why You Need a 5G Channel Calculator
Depending on the operating range, it sits at a particular location within a global frequency grid known as the ARFCN (Absolute Radio Frequency Channel Number). At lower frequencies below 3 GHz, the grid only has a small step of 5 kilohertz. From 3 GHz up to 24.25 GHz, the step increases to 15 kHz. In the millimeter wave range above 24.25 GHz, the step becomes even larger at 60 kHz.
If you select an incorrect raster step for your frequency range, the calculated center frequency will then be off by a tiny amount. Just enough to throw off synchronization. Fortunately, the tool can detect automatically in what range your frequency sits. No need to memorize the exact details from the 3GPP specs. Just know that the grid is not uniform.
The next important part is band validation. Your channel number may mathematically work, but that doesn’t make it valid for your equipment. For example, if you’re on band n78 then you can only operate within the frequency range from 3300 to 3800 megahertz. The calculator will test that boundary for you as well. And it looks at the duplex direction.
Some bands is Frequency Division Duplex, which means they have different ranges for the uplink and downlink frequencies. Other bands are Time Division Duplex, where the same range is used for both uplink and downlink. That’s another easy mistake to make during the planning phase. Does the channel you chose fall outside the allowed operating range for the band you said you’re operating? Again, this is a simple sanity check that avoids hours of troubleshooting downstream.
Engineers don’t give guard bands enough credit. Maybe you believe you own 100 megahertz of bandwidth. Because of the resource block grid and the physics of the subcarrier spacing, you’ll only be able to use slightly less. This means the calculator uses the number of channels (total channel width) and the desired subcarrier spacing to estimate how much spectrum you will occupy. Then it compares this occupancy area to the band edges.
Anything too near the edges risks exceeding the emission limits by emitting out-of-band energy. That’s where the guard margin check comes into play. Does the design leave you with room for a buffer? Or are you pinching the spectrum a bit too tightly? In a flawless lab scenario, maybe you can pull off a tight squeeze. Outside of the lab, with component tolerances and temperature variation, a tight squeeze doesn’t really work in the real world.
The other wrinkle is carrier aggregation. You want to combine several carriers together. There’s a requirement for how far apart the center frequency should be between carriers. The tool can calculate how much “spans” all of your carriers will take up combined. That lets you see whether your multi-carrier configuration will still stay within your licensed block. Adding more bandwidth isn’t enough. You’ve got to keep the grid intact. Unevenly spaced carriers create an interference pattern that’s difficult to trace down.
On the page there are reference tables of standard spacings for typical bands: n257, n28, n1 etc. They allow for quick lookups instead of making you dig through the docs every time you change bands.
This is the absolute location on the frequency scale where the RB grid exists (aka Carrier). This is what we call “Point A” inside the carrier. Moving Point A shifts the actual start of data transmission away from the mid-band frequency. The calculator finds Point A in terms of frequency, given your input values. This is another nuance, but it is important for more complex configs. For basic deployments, just ignore this. If you’re designing a complex private network though, knowing where Point A is enables you to line up with other 5G carriers or pre-existing LTE layers. Knowing where the data starts means knowing how to get that sweet, clear spectrum plot versus a cluttered one.
Some other bands (n257 and n260) are millimeter wave. Those have their own set of rules. They have higher frequencies, shorter wavelengths, and nasty path loss. These are the bands where the calculator switches over to the 60 kilohertz raster and adjusts the band boundaries to fit. And it warns you again that this kind of planning is not about sweeping wide areas; it’s about lining things up precisely.
The math gets bigger, but the concepts don’t change. Make your channel fit within the band. Provide space for the guard. Verify the raster. It is a little detail but it is significant.
The bottom line is that the calculator isn’t a substitute for site surveys. It’s just a way to ensure the numbers you come up with are sane before setting up the antennas. And it can catch those mathematical mistakes which lead to those silent failures. But you’re still responsible for knowing what your devices can support, how they might interfere with your neighbors, and what materials your house is made of. What you don’t need to spend time doing is converting frequencies or other low-level math. Leave that to the tool. Spend your effort figuring out the radio environment instead.
The grid is rigid. Use a flexible plan for the rest of the network to have a shot at working. Get started on the right channel.