HomeServerBlog battery charging planner
Battery Charge Time Calculator
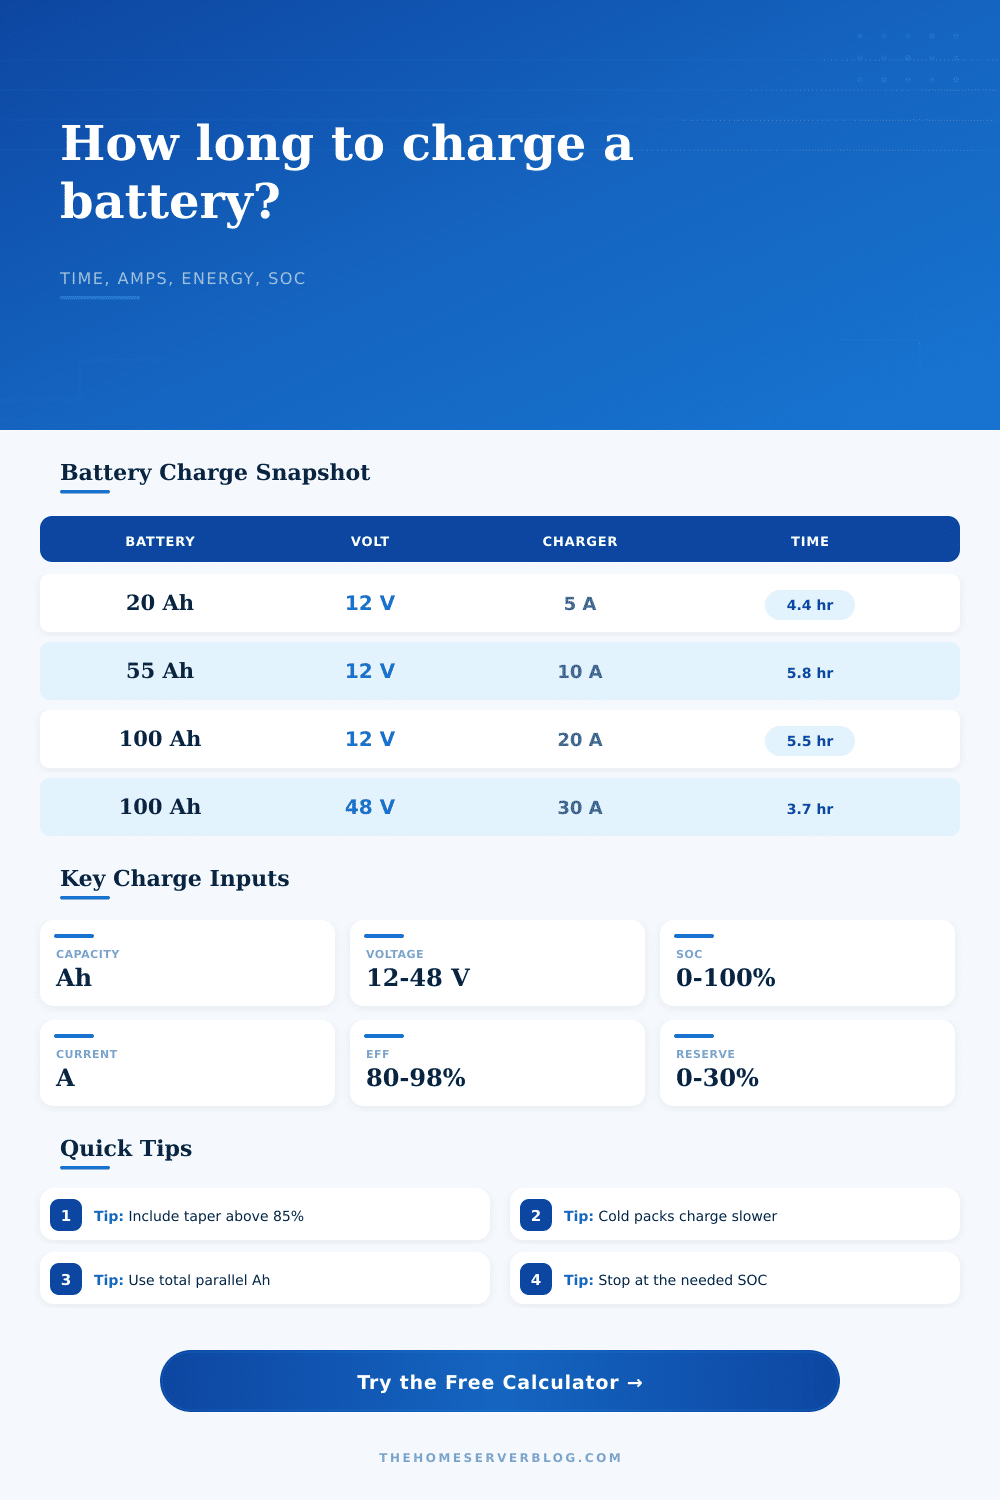
Estimate charge hours, wall energy, effective current, SOC gain, taper penalty, and reserve margin for UPS packs, LiFePO4 banks, AGM shelves, telecom strings, and small home server backup systems.
▦Battery presets
⚙Battery, charger, and SOC inputs
Calculation breakdown
Charge behavior check
📊Live planning cards
Rated Ah multiplied by parallel strings and aging allowance.
Effective current divided by usable bank Ah.
Time added by profile and high target SOC.
Approximate current sharing across parallel batteries.
🔋Chemistry comparison grid
📋Battery charge reference tables
| Chemistry | Common current | Finish behavior | Planning note |
|---|---|---|---|
| LiFePO4 | 0.2C to 0.5C | Short CV taper | Follow BMS and cell temperature limits. |
| AGM / SLA | 0.1C to 0.3C | Long absorb stage | UPS packs often prefer gentler charging. |
| Flooded lead | 0.1C to 0.2C | Absorb plus float | Ventilation and water level checks matter. |
| Li-ion NMC | 0.3C to 0.8C | Pack CV taper | Use the pack charger and BMS specification. |
C-rate is charger amps divided by total bank amp-hours. Pack data sheets override generic ranges.
| Profile | Base factor | High SOC taper | Best fit |
|---|---|---|---|
| LiFePO4 CC/CV | 1.08x | Mild after 90% | Rack batteries and drop-in LFP banks. |
| Lead bulk/absorb/float | 1.28x | Strong after 85% | Deep-cycle and standby lead-acid banks. |
| AGM conservative | 1.36x | Strong after 80% | Sealed UPS and network closet batteries. |
| Li-ion CC/CV | 1.14x | Moderate after 85% | Portable packs and protected lithium modules. |
| Solar controller average | 1.22x | Weather buffer | Off-grid shed, gate, and remote-node banks. |
The profile factor accounts for charging stages; reserve margin is applied separately.
| Pack type | Low SOC cue | Mid SOC cue | Full cue |
|---|---|---|---|
| 12.8 V LiFePO4 | 12.0-12.4 V | 13.0-13.2 V | 13.5-14.4 V charging |
| 12 V AGM rest | 12.0-12.2 V | 12.4-12.6 V | 12.8 V rested |
| 24 V lead bank | 24.0-24.4 V | 24.8-25.2 V | 25.6 V rested |
| 48 V telecom | 46-49 V | 50-52 V | 54-56 V float |
Voltage-only SOC is approximate. Rest time, load, chemistry, and charger stage can shift readings.
| Condition | Derate input | Typical effect | Charging caution |
|---|---|---|---|
| Warm room 20-30°C | 100% | Normal current | Use charger defaults. |
| Hot rack rear 35-40°C | 80-90% | Slower and warmer | Improve airflow and spacing. |
| Cool garage 5-10°C | 50-80% | Reduced acceptance | Lithium BMS may limit current. |
| Freezing LiFePO4 | 5-20% | Often blocked | Do not charge below battery spec. |
Use 100% when the charger and battery are both inside their normal temperature range.
💡Two battery charge time tips
Lightning flashes outside. The lights in your house blink. Your home server’s still alive. Then the UPS starts beeping “uh-oh.” The generator isn’t running. You’re aware that backup power won’t last long, but what will happen when you do plug it in?
Getting the system up again isn’t simply a matter of plugging it in; its knowing how much time you have once you’ve plugged it in.
How Long Does Charging Take?
Charging batteries is generally considered to be either full or empty, a binary switch. But there are other factor: current, voltage, temperature limits. To understand the answer, look at battery chemistry; the calculator can run those numbers for you. It’ll turn battery specifications into a timeline.
The clock starts ticking at the state of charge, and it is rarely where you think it is. Thirty percent state of charge can feel depleted, yet hold energy. Where do you stop? That’s where work starts.
Charging the first half (say) take less time then chasing those final 10% of capacity. That’s the taper effect, the moment the charger shifts from bulk current to slow trickle to balance cell charges.
Want something online in an hour? Aim for roughly ninety percent state of charge; that makes sense. Want maximum longevity? Let it float. The tool accounts for the slowing charge rate and includes time penalties that would of been missed if you just divided capacity by current.
Another big factor for charge time is temperature. Batteries don’t like cold. By sliding the derate temp slider down, you are telling the battery management system that chemistry is moving slower (lithium ions) in colder temps. Since it recognizes this slower chemistry, it won’t let too much current through for fear of plating, a dangerous buildup of metal that ruins cell. That’s why a four-hour charge in July could be six hours in January. Don’t think your charger is bad, it isn’t; it’s the physics keeping the pack safe. There are reference tables out there detailing various chemistries’ handling of this but the take-away here is that ambient air does matter.
There’s also an invisible price: inefficiencies. When electricity is converted into another form, some of it is lost. That means the battery stores less than the wall has energy. Moddern switch-mode units are cool-running and efficient. Cheaper ones will be hot-running and wasteful of electricity. If you run one off a solar array or generator, that loss of efficiency increase your need for more panels or fuel. You’re paying for what you don’t want: heat.
Complexity of parallel string
Adding another battery in parallel doubles amp-hour capacity, but if your charger can’t output sufficient current, then doubling the number doesn’t necessarily half the charge time. In fact, that may extend it as you have doubled the number of loads and need to feed two from the charger. This is where understanding per-string current comes into play. You can visualize splitting the load between the batteries. An older battery with higher internal resistance could hog the current, leaving the other one behind.
That’s why the reserve margin input act like an insurance policy. It protects against this effect as well as aging cells and imprecise multimeter readings.
Speed versus health
The tradeoff between charge speed and battery longevity is a negotiation: fast = heat & stress, while slow = lost time/opportunity. By showing this tradeoff between battery longevity and wall hours, the tool can help you find the middle ground.
First pick a rig-preset that best fits your rig. Then tweak the sliders according to your charger age/room temp. The result isn’t a number… It’s a plan.
Next time the power goes out, you’ll know when your server gets back on line and whether you should stop at ninety or wait until the last percent. Your battery chemistry doesn’t care about storms, but your uptime does.