HomeServerBlog power redundancy planner
Redundant Power N Plus One Calculator
Size modular rack power, rectifier shelves, UPS modules, DC plants, or dual power trains from total load, module capacity, installed count, N+1, N+2, 2N mode, derate, offline maintenance, failures, utilization target, growth, and reserve.
1Redundancy presets
2Power module and failover inputs
Module sizing breakdown
Failover and reserve check
3Live power cards
Effective kW each after the selected derate.
Total derated capacity before offline modules.
Maintenance plus failure modules removed.
Installed modules above the target-utilization N count.
4Topology grid
5Redundancy tables
Calculated mode comparison
| Mode | Installed target | Spare logic | Status |
|---|---|---|---|
| N | 0 modules | No spare module | Calculate to compare |
Failover state table
| State | Online modules | Capacity | Load percent |
|---|---|---|---|
| Normal | 0 | 0 kW | 0% |
Module capacity quick reference
| Module rating | Typical use | Derate note | Planning note |
|---|---|---|---|
| 0.75 kW | Small DC shelf or appliance PSU group | Good for compact network closets | Use more modules for clean N+1 service |
| 1.5 kW | NAS, PoE, and small rack UPS modules | Watch heat at high load | Often fits 2 to 5 kW home lab loads |
| 3 kW | Rack UPS module or rectifier shelf | Common modular step size | Useful when growth margin is real |
| 5 kW | Dense rack power train | Check branch circuit and frame limit | Pair with strict utilization targets |
| 10 kW | Edge pod or micro data room module | Cooling and PDU limits dominate | 2N designs need full duplicate paths |
Redundancy rule of thumb
| Topology | Use when | Strength | Watch item |
|---|---|---|---|
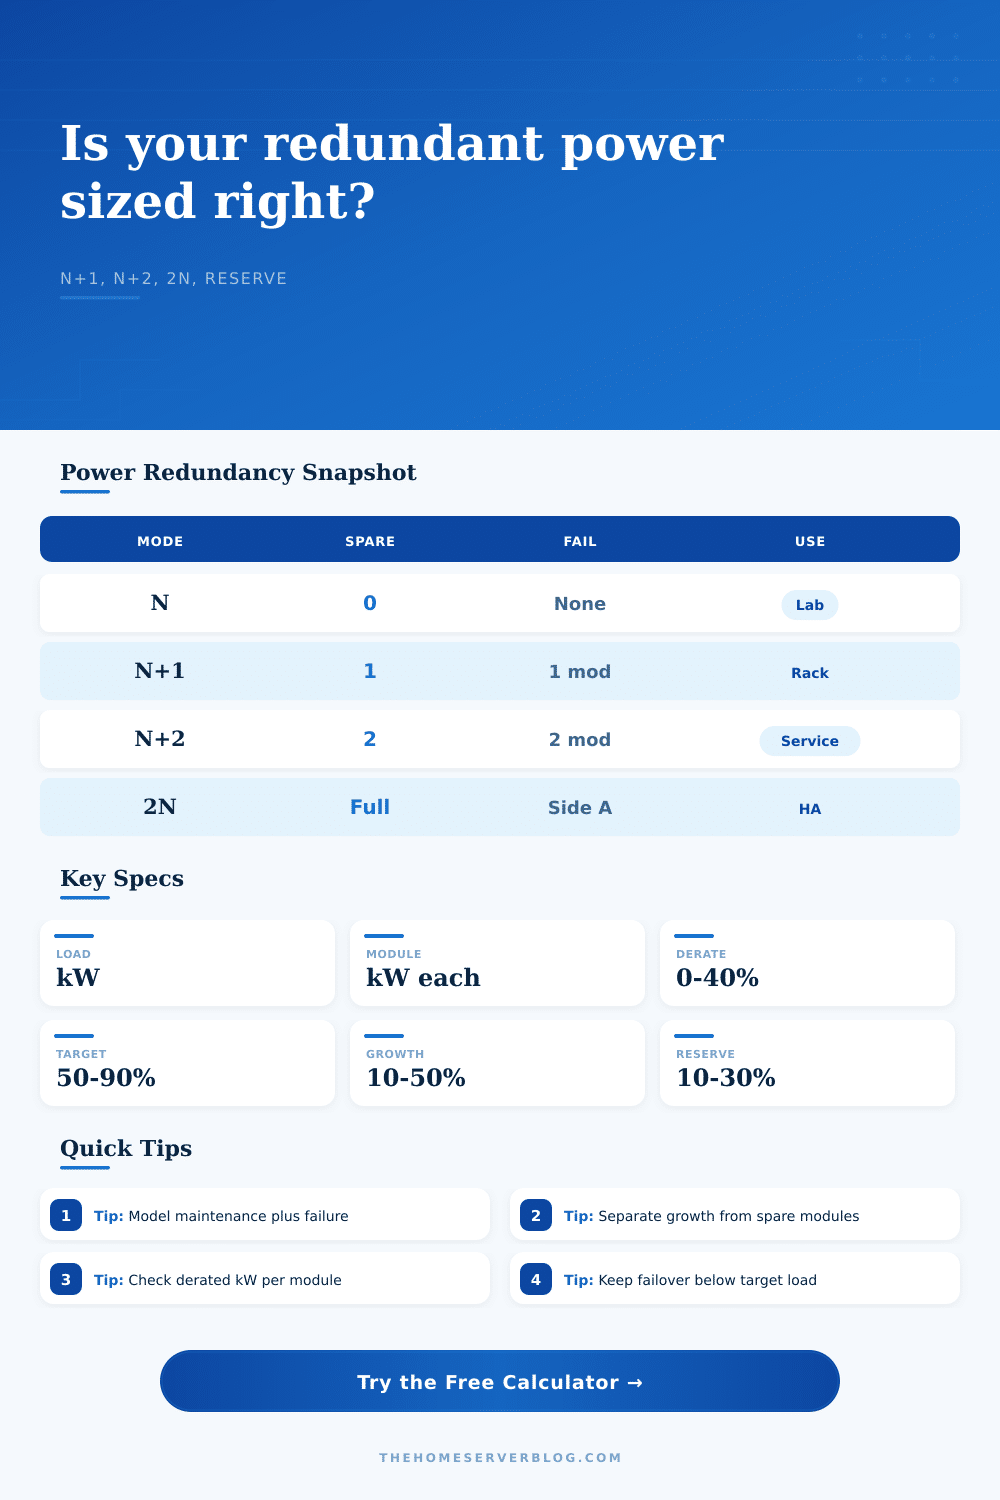
| N | Lab, dev, or temporary rack | Lowest installed count | No spare module coverage |
| N+1 | Home server rack or small office core | Survives one module loss | Service work consumes the spare |
| N+2 | Maintenance-heavy or remote site | Survives service plus fault | Frame slots and load sharing |
| 2N | High availability services | Duplicate power train | Requires separate paths and transfer plan |
6Power redundancy tips
A server rack turning black while doing a critical update will get those panic buttons going. But it’s not just about hardware failing. It’s the power feeding the hardware that’s the problem. For most, redundancy = buy additional hardware and plug it in. That’s not how it works.
Before system is up and running, you must consider environmental and load weight factors. Once you know your module specs and load, calculator does the math for you. It avoids guesswork on what to convert and what coefficient to use. Converts abstract reliability goals to concrete module counts.
Planning Power for Your Servers
But you must know that N plus one isn’t as safe as you think. First there’s an N (the base load). Then you have a redundant module as a backup. Sounds good right? But that redundancy is also your maintenance buffer. So if you lose a bad unit, then another goes down at the exact same time, what happens when you swap out bad one? Your N plus one safety net now has a hole in it. That’s where many folks fall short. They will plan for normal operations but not account for service window.
You can model failures from maintenance and offline modules separately for both situations, this shows how easy it is to survive one failure, but also how much is needed to survive a failure plus maintenance…
The nameplate ratings may be misleading as well. On the box, the module says it’s a three kilowatt module, but in a crowded hot rack, it won’t provide you with three clean kilowatts. Altitude reduces its capacity. Ambient heat reduces its capacity. Harmonic distortion reduces its capacity. That is where concept of derating comes from.
Don’t discount the environment the hardware will live in. The calculator uses a reduction percentage to arrive at your actual usable capacity. Assume a full output and you’re designing a system that may look good on paper but it will shut down because it overheated in reality. It’s a little thing, but it makes a big difference when it comes to long term stability. You don’t want to know what hardware can output for five seconds in a lab test. You want to know what it can sustain over years.
The second issue with power planning is growth. You’re going to add more network gear, GPUs, or drives tomorrow. What you’ve got today is what you size your rack for but unless you leave room for growth, you’ll reach a wall. At some point, adding one more server mean swapping out your whole power distribution unit. Growth margin and reserve prevent you from painting yourself into a corner. When you eventually decide to upgrade, they ensure you have left yourself enough room to do so without buying new infrastructure. Adding a few more modules now is cheaper than buying a whole new frame later.
Two N and higher availability designs takes this even further by doubling the entire power path. While overkill for a couple of NAS devices at home, it’s required for data centers where they simply cannot have any downtime. The tool lets you draw out your topologies and see the number of modules required for each mode (hence the name). Now you can compare the risk with the cost. And you know precisely what number of spares to have if you want to survive a full side failure or double fault. There is no more marketing jargon; just raw numbers of capacity. This is the final word.
Power sizing is all about managing risk, not just kilowattage. You are buying peace of mind. The calculator provides those numbers but ultimately it’s up to you to determine what amount of downtime you’re willing to accept. If you run a small office or a densely packed GPU cluster, the objective is the same. When something go wrong, you want the lights to stay on.
Modeling out the worst case scenarios ahead of time turns a possible disaster into a non event. Having the spare capacity and not needing it is better than needing it and watching your uptime metrics crash. You should of planned for this more naturaly.