HomeServerBlog storage performance planner
Block Size Throughput Calculator
Convert block size and IOPS into practical storage throughput, then check read/write mix, protocol overhead, compression, deduplication, queue depth, media capacity, network link fit, and latency target for NAS, VM, database, backup, and home lab workloads.
1I/O presets
2Throughput inputs
Throughput breakdown
Bottleneck and latency check
3Media quick specs
4Workload comparison grid
5Block-size reference tables
| IOPS | 4 KiB | 8 KiB | 16 KiB |
|---|---|---|---|
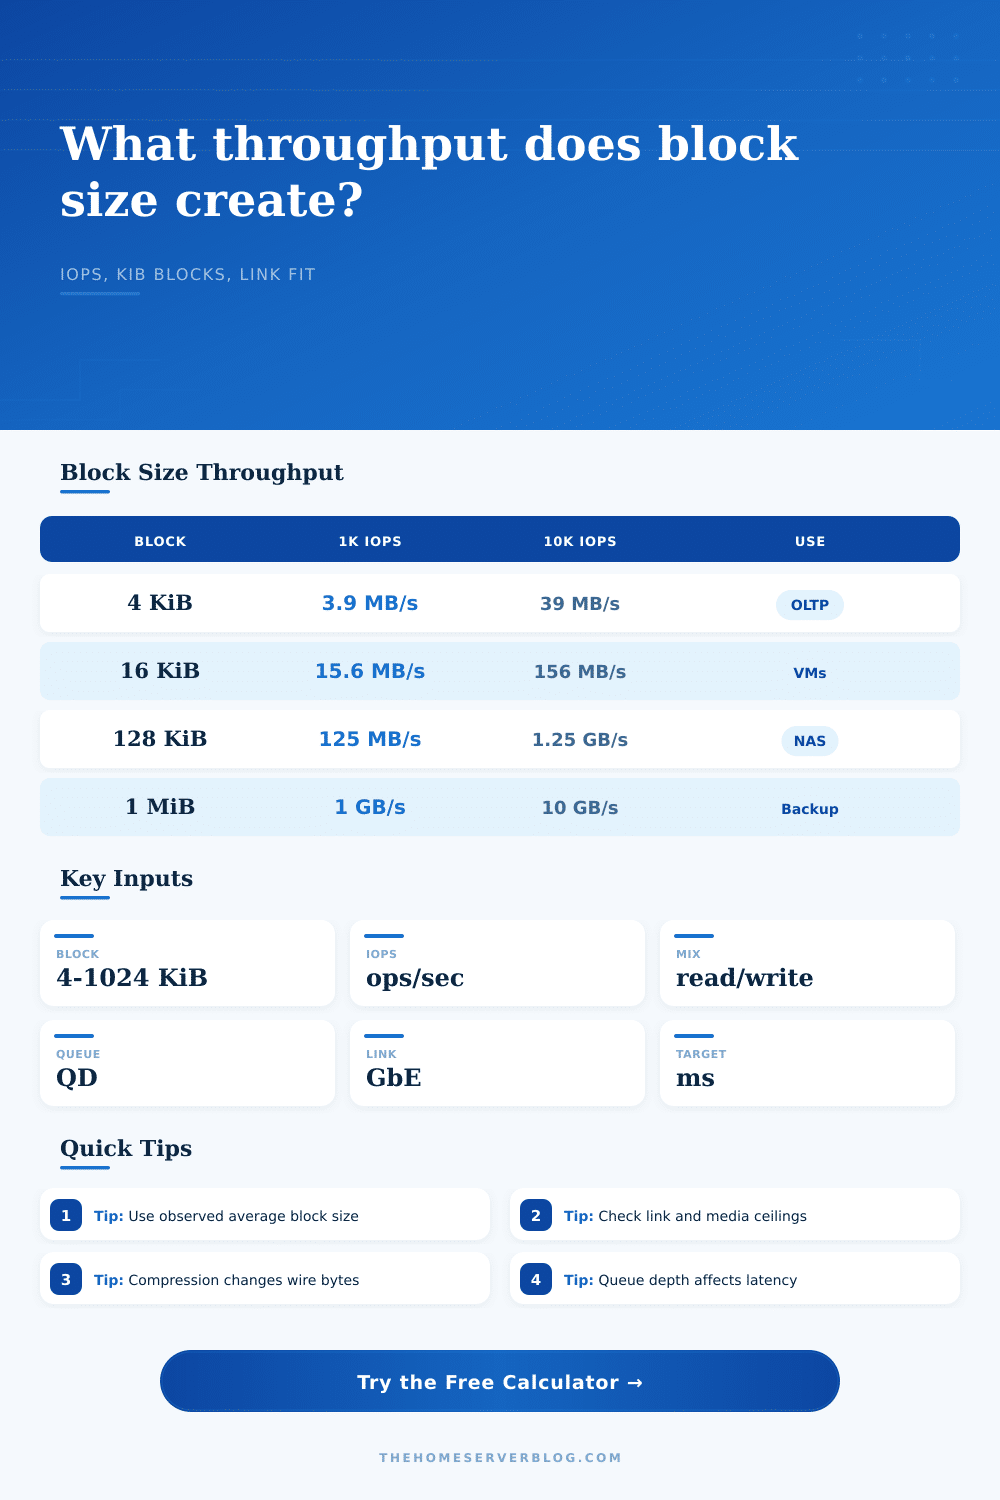
| 1,000 | 3.9 MB/s | 7.8 MB/s | 15.6 MB/s |
| 10,000 | 39 MB/s | 78 MB/s | 156 MB/s |
| 50,000 | 195 MB/s | 391 MB/s | 781 MB/s |
| 100,000 | 391 MB/s | 781 MB/s | 1.56 GB/s |
Small blocks reveal IOPS and latency limits before sequential bandwidth limits appear.
| IOPS | 64 KiB | 128 KiB | 1024 KiB |
|---|---|---|---|
| 500 | 31 MB/s | 62 MB/s | 500 MB/s |
| 1,000 | 62 MB/s | 125 MB/s | 1.00 GB/s |
| 5,000 | 312 MB/s | 625 MB/s | 5.00 GB/s |
| 10,000 | 625 MB/s | 1.25 GB/s | 10.00 GB/s |
Large blocks can saturate links with surprisingly low IOPS, especially during backups and restores.
| Link | 4 KiB IOPS | 128 KiB IOPS | 1 MiB IOPS |
|---|---|---|---|
| 1 GbE, 118 MB/s | 30k | 944 | 118 |
| 2.5 GbE, 295 MB/s | 75k | 2.4k | 295 |
| 10 GbE, 1180 MB/s | 302k | 9.4k | 1.2k |
| 25 GbE, 2950 MB/s | 755k | 23.6k | 3.0k |
This table ignores protocol overhead, so real link saturation usually arrives slightly earlier.
| Block range | Common source | Best watched metric | Practical note |
|---|---|---|---|
| 4-8 KiB | Databases | Latency | Fast random IOPS and low queue time matter. |
| 16-64 KiB | VM storage | Mixed load | Boot storms and snapshots can shift the average. |
| 128-256 KiB | NAS files | Link fit | Good match for many SMB and ZFS file workloads. |
| 512-1024 KiB | Backup streams | Throughput | Network and sequential write ceilings dominate. |
If you do not know the block size, compare at least one small, one medium, and one large block scenario.
6Two block-size throughput tips
For example, you could have a super-fast storage array (megabytes per second), yet still be slow at accessing even something as simple as a text file. The reason is that people confuse bandwidth with performance.
Bandwidth is width of pipe. How fast is the data moving down the pipe? If you increase speed of pipe (e.g., go from 1Gbit/s ethernet to 10Gigabit), then you will increase performance, but you also can’t ignore size of data blocks you are trying to access. That’s what we mean by block size. Block size refer to the average size of read/write operations that your application(s) is doing. Does it limit how much data your system can move, or does it limit how many operation can get done?
Bandwidth Is Not the Same as Speed
A database workload is composed of lots of little blocks. They is often just four or sixteen kilobytes. That’s thousands of small requests per second. One thousand operations per second on a drive sounds pretty good, right? With four-kilobyte block that drive barely shuffles around four megabytes worth of data.
The problem isn’t the cable. It’s the extra work of addressing all those little chunks. There are so many little things to do, one at a time. Queue depth and latency become important because a drive has to finish one little thing before it can move onto next one.
Plug your block size and expected IOPS into the calculator and let it do the math for you. You don’t have to guess anymore if your hardware will keep up with random access demand.
Flip this back to a rendering video or a backup job and suddenly those blocks gets bigger; hundred-kilobyte or -megabyte-sized. A thousand ops-per-second becomes a gigabyte of throughput. Now the drive head (or whatever’s controlling flash) has less need to jump all over the place. It can just stream it out sequentially, something that moddern drives are designed for. The limitation moves away from random access to speed of the bus or network link. Your 10-gigabit network may feel like an open highway while your SATA link chokes on your backup stream. Surprisingly small numbers of IOPS can saturate a link if your block size is big enough. See reference table for some examples.
But there are more layers to this story. Deduplication and compression are yet another layer. Compression reduces the amount of data that crosses the wire and shrinks its physical footprint. But it doesn’t reduce the number of logical operations that your application issue. If compression reduces data from ten thousand four-kilobyte reads down to two megabytes written to the disk, you still issue ten thousand database requests. Those trigger an I/O and hit the CPU, so you’re still paying the price.
People think smaller = less work. Smaller might mean fewer bits cross the network, and fewer bits on the disks, but it can mean more work on the CPU and more work on the controller. There’s no one answer; you need to determine what’s important based off how you’re using the system.
(Is it a lot of reads or writes? Does it matter that much? In general, a read-heavy workload might be cheaper overall. This depends on the type of workload, such as if you’re running virtual machines with lots of reads and writes. This mix have a different penalty structure: Generally, writing costs more because it updates metadata. On an SSD, it often triggers garbage collection. Depending on the mix of reads and writes, a heavy write workload can drag down latency quicker then a read-heavy workload. You could of use the tool to change this.
It’s all about fitting the storage plan to the shape of your data. You can’t use a big pipe if it doesn’t have any taps. You don’t need a high-IOPS drive if you’re just copying huge files around.
Knowing what drives different performance characteristics (throughput vs. Operation count) prevents you from buying hardware because of marketing specs. You begin constructing systems that perform well under actual workloads. This isn’t about getting the biggest number, this is about getting the correct number for the task at hand.