HomeServerBlog Kubernetes capacity planner
Cluster Autoscaler Calculator
Estimate how many Kubernetes worker nodes a cluster autoscaler needs from pod requests, node allocatable resources, daemonset overhead, pod density limits, min/max bounds, rollout surge, and spare capacity.
▣Cluster presets
⚙Autoscaler inputs
Formula breakdown
Autoscaler status
▦Equipment and node profile comparison
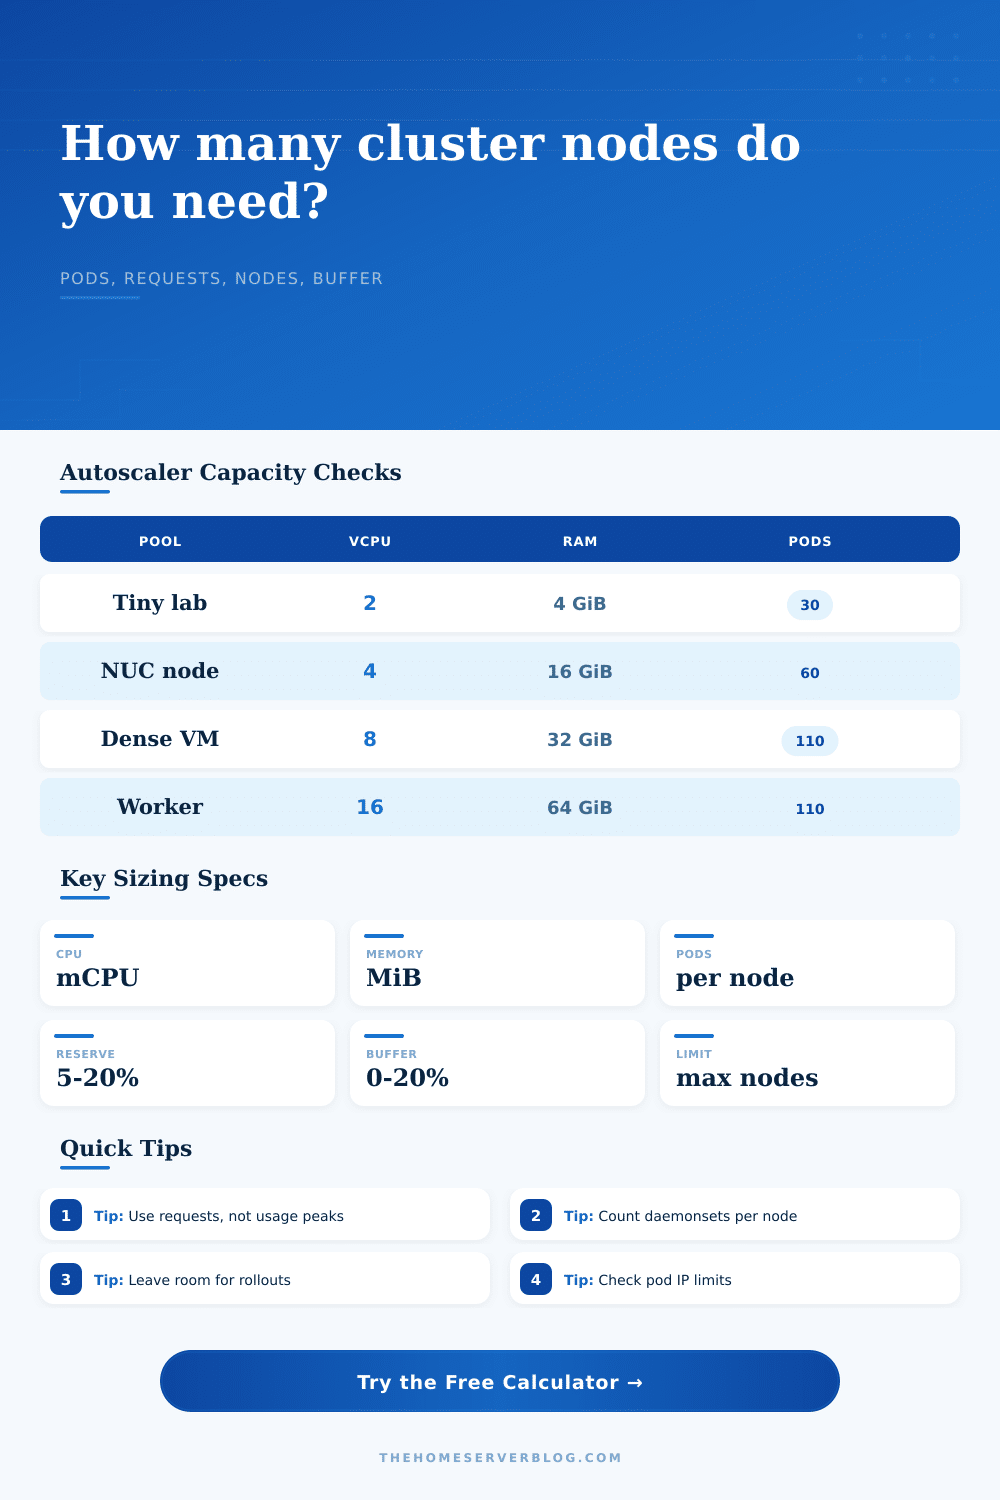
Tiny lab node
2 vCPU4 GiB RAM, 30 podsGood for K3s agents, edge labs, and very small control-plane adjacent workloads.
Mini PC node
4 vCPU16 GiB RAM, 60 podsBalanced home lab worker for web apps, DNS, media helpers, and monitoring agents.
Dense VM node
8 vCPU32 GiB RAM, 110 podsComfortable for Proxmox, vSphere, or cloud-like VM pools with many replicas.
Storage worker
8 vCPU64 GiB RAM, 90 podsMemory-rich node for databases, indexers, backup services, and NAS-side workloads.
Compute worker
16 vCPU64 GiB RAM, 110 podsBest for CI runners, batch jobs, queues, and CPU-heavy app replicas.
Memory worker
16 vCPU128 GiB RAM, 110 podsUseful for caches, Java services, search, and metrics systems with high RAM requests.
GPU worker
24 vCPU192 GiB RAM, 60 podsDesigned for fewer, larger pods where accelerators and node selectors restrict placement.
Balanced VM
4 vCPU8 GiB RAM, 50 podsCommon small cloud or virtualization shape where memory, not pod count, often binds first.
📊Current sizing metrics
Allocatable after system reserve and daemonset CPU requests.
Allocatable after memory reserve and daemonset memory requests.
What the current worker count can place with these requests.
Remaining workload slots after the buffered target is scheduled.
🗂Reference tables
Capacity by node profile
| Profile | vCPU | Memory | Typical max pods |
|---|---|---|---|
| Tiny lab | 2 cores | 4 GiB | 30 pods for lightweight K3s nodes |
| Mini PC | 4 cores | 16 GiB | 60 pods keeps CNI and kubelet overhead sane |
| Dense VM | 8 cores | 32 GiB | 110 pods is a common Kubernetes ceiling |
| GPU worker | 24 cores | 192 GiB | 60 pods because placement is usually constrained |
Autoscaler behavior checks
| Condition | Calculator treatment | Why it matters | Watch for |
|---|---|---|---|
| Unschedulable pods | Scale when target exceeds current slots | Cluster Autoscaler reacts to pending pods | Missing requests can hide demand |
| Min nodes | Recommendation never drops below minimum | Protects baseline services and quorum | Too high wastes idle capacity |
| Max nodes | Flags when raw need exceeds maximum | Prevents silent scale-up failure | Cloud or VM quotas can bind too |
| Spread factor | Rounds nodes to domain multiples | Helps zone, rack, or host balancing | Strict anti-affinity may need more |
Resource formulas and conversions
| Item | Formula | Example | Use |
|---|---|---|---|
| CPU capacity | vCPU × 1000 mCPU | 4 vCPU = 4000 mCPU | Matches Kubernetes request units |
| Memory capacity | GiB × 1024 MiB | 16 GiB = 16384 MiB | Matches scheduler memory requests |
| CPU pods/node | floor(allocatable / pod request) | 3350 / 250 = 13 | Finds CPU-bound placement |
| Node count | ceil(effective pods / pods per node) | 64 / 13 = 5 nodes | Before min/max and spread rounding |
Common home lab project sizes
| Project | Pod pattern | Typical request | Sizing note |
|---|---|---|---|
| Home app stack | 20-50 replicas | 100-300 mCPU, 256-512 MiB | Often CPU-bound on small nodes |
| Observability | 10-30 replicas | 250-1000 mCPU, 1-4 GiB | Memory and disk IO dominate |
| CI runner pool | 5-80 job pods | 1-4 cores, 2-8 GiB | Scale-up latency matters |
| Edge API | 100+ small pods | 50-150 mCPU, 128-256 MiB | Pod density or IP limits may bind |
These tables use scheduling math, not live metrics. Kubernetes places pods from requested CPU and memory, then the autoscaler adds nodes when pending pods cannot fit the current node group.
⚡Autoscaler sizing tips
You know that feeling when you deploy something new in Kubernetes and your dashboard goes all red because some of the pods are still pending? Most of the time, that’s not because your app’s logic failed. That’s because your cluster has run out of physical capacity to serve more workloads.
Enter the cluster autoscaler, which is supposed to scale up nodes when demand increases and down when demand decreases. But the autoscaler isn’t magic. It works based off math. Give it bad numbers and it’ll let you down when you need it most.
Why Your Kubernetes Cluster Runs Out of Space
Resource requests vs. This is about node size. People gets this wrong so much. Resource requests aren’t based on your guess of how much work a workload will do. It’s based on what the scheduler sees. Tell the scheduler that a pod requires two cores? It’ll find two cores. Even if the container runs at 10% of a core. Once you enter in reasonable request values, the calculator figures out the rest. It protects you from having to convert and guess at coefficients.
However, with each node that you add comes a hidden cost: an overhead. Even before you launch your application pods, the node already runs some system services:
* The container runtime.
* The kubelet.
Networking is handled via the CNI plugin. Storage is provided via the CSI driver. These are often log agents or metrics collectors. Daemonsets are typically deployed on each node. They take up some memory and CPU. Before you can allocate any memory or CPU to your own applications, these daemonsets gobble them up. On paper, it might look like the cluster has free resources. But in reality, the scheduler won’t see anything open.
To get your actual allocatable resources, you need to take this overhead away from what you have as total hardware capacity. So now that you have the real numbers, it’s time to determine how much slack to put into the system. Zero buffer may be cheaper (on cloud bills/hardware). There is no room for error. There’s a roll out of a new deployment. So there needs to be some temporary scaling up.
What happens if a sudden traffic spike requires three extra replicas? The baseline load maxes out the nodes. Now the autoscaler has to buy time to provision more hardware. And while those pods are waiting, that’s when availability dies. Most teams have a ten to twenty percent buffer. That is the difference between a nice deployment and a page at three in the morning.
So how do you know what shape your nodes should take? Quantity alone doesn’t solve all problems. Massive machines are no magic fix. Many small nodes work well for very dense workloads such as API servers. They request little memory but host lots of pod. Fewer but bigger nodes have very high memory limits. They serve big workloads such as databases and Java applications. Running mixed workloads on the same kind of node will be wasteful. Memory-optimized nodes can end up having gigs of RAM sitting around while their CPUs are being maxed out. CPU-optimized nodes can end up maxing out on memory while leaving some cores unused. The calculator visualizes that mismatch for you. It highlights the bottleneck resource. Do you need wider nodes because it’s CPU-limited? Or do you need taller nodes because it’s memory-limited.
It’s also a race against latency. If the autoscaler finds that there are unschedulable pods, it decides that we need another node. It communicates with the cloud provider to ask them to spin up the node. That node then has to join the cluster, pull down the images, get running. This might take minutes. You have some buffer to account for that gap. Otherwise, as your backend catches up, your users would see errors. So, the tool considers that surge capacity. And you use that to determine exactly how many nodes you need to handle the worst case.
Just planning for an average day doesn’t cut it. The size of your cluster isn’t a prediction of the future; it’s a constraint on today. It’s a tradeoff between available resources vs. Price. It’s a tradeoff between safe deployments vs. Efficient hardware usage. Honor the requests, but also get the overhead correct. Make sure there is plenty of wiggle room in case something unforeseen happens. Give the autoscaler a fair fight and it’ll do its work.