HomeServerBlog service capacity planner
Concurrent Connection Memory Calculator
Estimate RAM used by simultaneous sockets, sessions, TLS state, kernel buffers, worker stacks, and safety headroom before exposing a service, proxy, database pool, or broker to a larger client count.
▣Connection workload presets
⚙Memory model inputs
Formula breakdown
Capacity signal
🖥Equipment and service comparison grid
📊Quick memory indicators
Open client sockets before burst adjustment.
Extra sockets for reconnect or traffic spikes.
Encryption state added to each open connection.
Space held back for OS, cache, and neighboring services.
📘Reference tables
Workload profile memory estimates
| Configuration | Base per connection | Active extra | Daemon baseline |
|---|---|---|---|
| Nginx or Caddy static HTTP | 32 KiB | 8 KiB | 90 MiB |
| Traefik or HAProxy TLS proxy | 64 KiB | 14 KiB | 180 MiB |
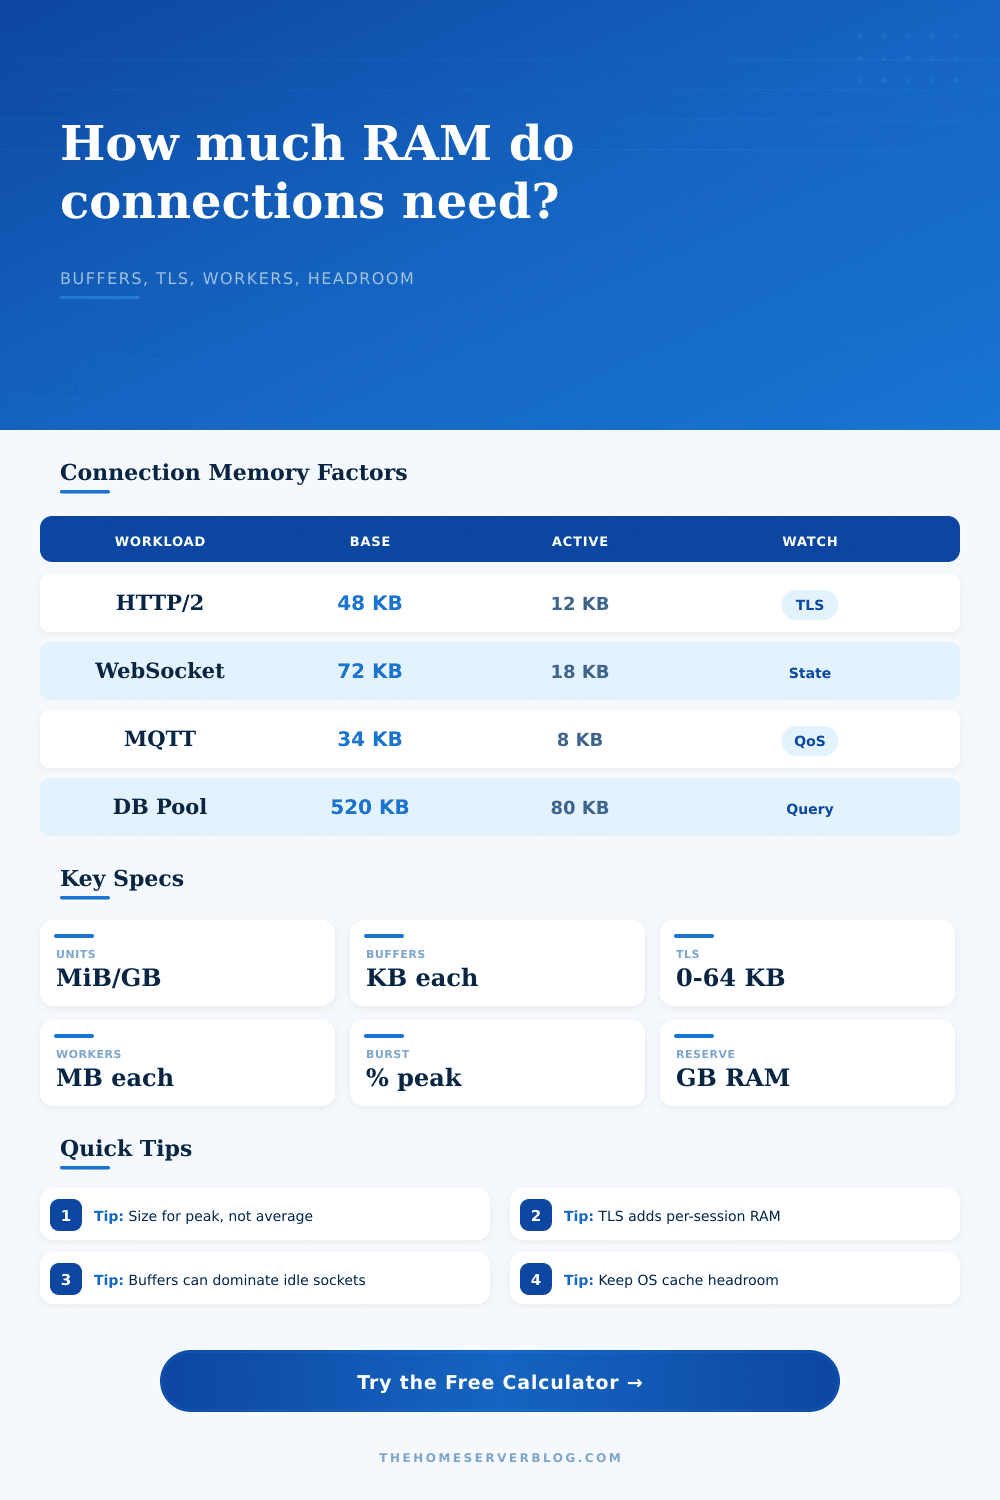
| WebSocket dashboard or home app | 72 KiB | 18 KiB | 220 MiB |
| MQTT broker for sensors | 34 KiB | 8 KiB | 120 MiB |
| PostgreSQL connection pool | 520 KiB | 80 KiB | 360 MiB |
| SMB or NFS file share clients | 180 KiB | 42 KiB | 300 MiB |
Buffer sizing reference
| Buffer choice | Per direction | Total RX plus TX | Good fit |
|---|---|---|---|
| Very small IoT clients | 8 KiB | 16 KiB | MQTT, tiny REST, control APIs |
| Normal HTTP services | 32 KiB | 64 KiB | Reverse proxy, web UI, dashboards |
| Large response queues | 128 KiB | 256 KiB | Downloads, media metadata, slow clients |
| High BDP links | 512 KiB | 1024 KiB | WAN, satellite, long fat pipes |
| Database or file clients | 256 KiB | 512 KiB | SMB, NFS, SQL, object storage |
Worker model comparison
| Worker model | Multiplier | Memory behavior | Capacity note |
|---|---|---|---|
| Event loop, mostly shared stack | 0.25x | Small resident worker footprint | Best for many idle sockets |
| Async proxy with small workers | 0.45x | Shared runtime with per-worker queues | Common for home reverse proxies |
| Thread pool, partial stack committed | 0.65x | Stack reservation can become real RAM | Watch high thread counts |
| Process per worker | 1.00x | Private heaps and libraries per process | Predictable but heavier |
| JVM or .NET managed workers | 1.25x | Runtime, JIT, heap, and GC metadata | Give more baseline RAM |
Common home server project sizes
| Project | Typical clients | Memory pressure | What to tune |
|---|---|---|---|
| Personal reverse proxy | 50 to 300 | Low unless TLS queues grow | Keepalive timeout and send buffers |
| Public dashboard or status page | 500 to 5000 | Moderate during reload bursts | Worker count and TLS session reuse |
| MQTT home automation broker | 100 to 3000 | Low idle, queue-heavy under outages | QoS, retained messages, inflight limits |
| Database-backed app stack | 20 to 500 | High per database backend | Pool size and query memory |
| Family NAS and media server | 5 to 80 | Moderate, tied to active file work | File buffers and media sessions |
💡Memory planning tips
So you begin by setting up some basic home server (e.g. This includes a Raspberry Pi cluster or an old laptop. Everything works fine: the web dashboard opens immediate; your smart lights recieve data from the MQTT broker just fine. You call over a few friends, or there’s a bunch of holiday traffic on your personal connection… and the system grinds to a halt.
Did something break? No, it’s simply out of memory, too many connection requests for the system to manage. It’s not usually a CPU bottleneck which makes this show up more as RAM exhaustion.
How to Plan Your Server Memory
This is because network sockets is how operating systems work. They take up memory when they’re opened and they keep using memory whether they do anything or not. If you encrypt your traffic, it also keeps session keys, buffers for your data, and manages TCP handshakes. You’d expect an idle socket to be free, but it’s a tiny leak which accumulates as you have more and more client.
Run the numbers through the calculator above. It will convert all that theoretical overhead into something concrete: gigabytes.
Take the example of a database pool versus a static site. One is a heavyweight connection, reserving memory to hold transaction logs and query buffers. The other has little overhead beyond keeping the connection open, or simply serving up the file and closing the connection. You’ll run out of RAM long before you reach your bandwidth cap if your app opens a fresh database connection for each web request.
That’s where connection pooling comes in, and that’s why knowing how much memory is being used per connection are important. This tool lets you see that cost by separating the application state from the buffer memory.
But encryption isn’t free; it’s another level of complexity added by TLS. For each secure connection, TLS need memory for handshake buffers, record sequence numbers, and symmetric keys. This overhead doubles the memory used by your connections in an environment with many simultaneous connections. And if you’re running a reverse proxy terminating SSL for dozens of internal services, those per-session costs adds up.
Make sure your host has enough RAM to handle these cryptographic handshakes, especially during sudden spikes in traffic when users reconnect after a network glitch or reload a page.
The other important piece is the worker model. Event-loop based servers such as Node.js and Nginx only requires a small amount of memory per connection as they handles lots in a single thread. Thread-per-connection models reserve a stack for each thread which tends to be megabytes of memory. Multiplied by a couple hundred connections, that’s gigabytes before doing any work.
The calculator accounts for this; you can pick your concurrency model, and the estimate will reflect how you run it.
And don’t forget the operating system: To increase performance, Linux caches data from disks into free RAM, but as soon as an app needs it, memory becomes available again. But if your service uses all the available bytes, there’s nothing left for the OS to use for page cache, DNS resolution, emergency logging, etc. So it’ll begin swapping to disk, which is much slower than RAM. And then the whole thing spirals out of control. Always leave yourself a buffer for the OS and other daemons.
The tool will help you define that buffer; it will also show you if you can fit your desired number of connections inside the remaining budget.
Don’t make the mistake of sizing for average load. Size for peak load + some safety margin. Burst conditions; device wake-ups, traffic spikes, browsers reconnecting, will briefly increase your connection count several fold. Small bursts against a memory constrained budget can cause your server to go oom with out-of-memory errors. Headroom isn’t just good planning, it’s what separates a fragile server from a stable one.
So what is this whole memory management thing? Prediction. You don’t know how many clients are going to hit your service, but you do know how large of a space you want to set aside for those clients. Knowing the cost per worker thread, per tls session, per client socket makes you go from guessing to engineering.
An engineer uses the numbers from a calculator, but the real insight is knowing that every open connection reserve part of your available capacity. Maintain a healthy reserve and regardless of how many people come knocking, they’ll never find you hanging up on the line.