Connection Pool Size Calculator
Estimate database connection pool settings for apps, APIs, dashboards, and home lab services by balancing peak request rate, connection hold time, burst behavior, worker limits, DB reserved slots, and per-connection memory.
▣Connection pool presets
⚙Pool sizing inputs
Connection pool recommendation
ReadyFormula breakdown
Capacity health
🖥Database and pooler comparison grid
Dedicated backend per client; small pools protect memory and CPU scheduling.
Thread or pool overhead varies by config; idle sessions still consume server resources.
App-side pooling is common; size for active work and reserve login capacity.
Driver pools handle socket reuse; watch server connection and operation concurrency.
Reduces app churn but still keeps server sessions tied during client sessions.
Transaction pooling multiplexes many app clients onto fewer database backends.
Fronts MySQL pools and can reduce backend sessions with routing and multiplexing.
Connections are lighter, but blocking commands and pub/sub still need separation.
📊Reference tables
Sizing formulas used by this calculator
| Step | Formula | What it means | Result impact |
|---|---|---|---|
| Base active connections | RPS x DB ops/request x hold seconds | Little's Law estimate of simultaneous checked-out connections. | Primary demand before bursts. |
| Burst adjusted demand | Base active x traffic burst factor / multiplex factor | Accounts for uneven arrivals and poolers that share backend sessions. | Raises or lowers total pool target. |
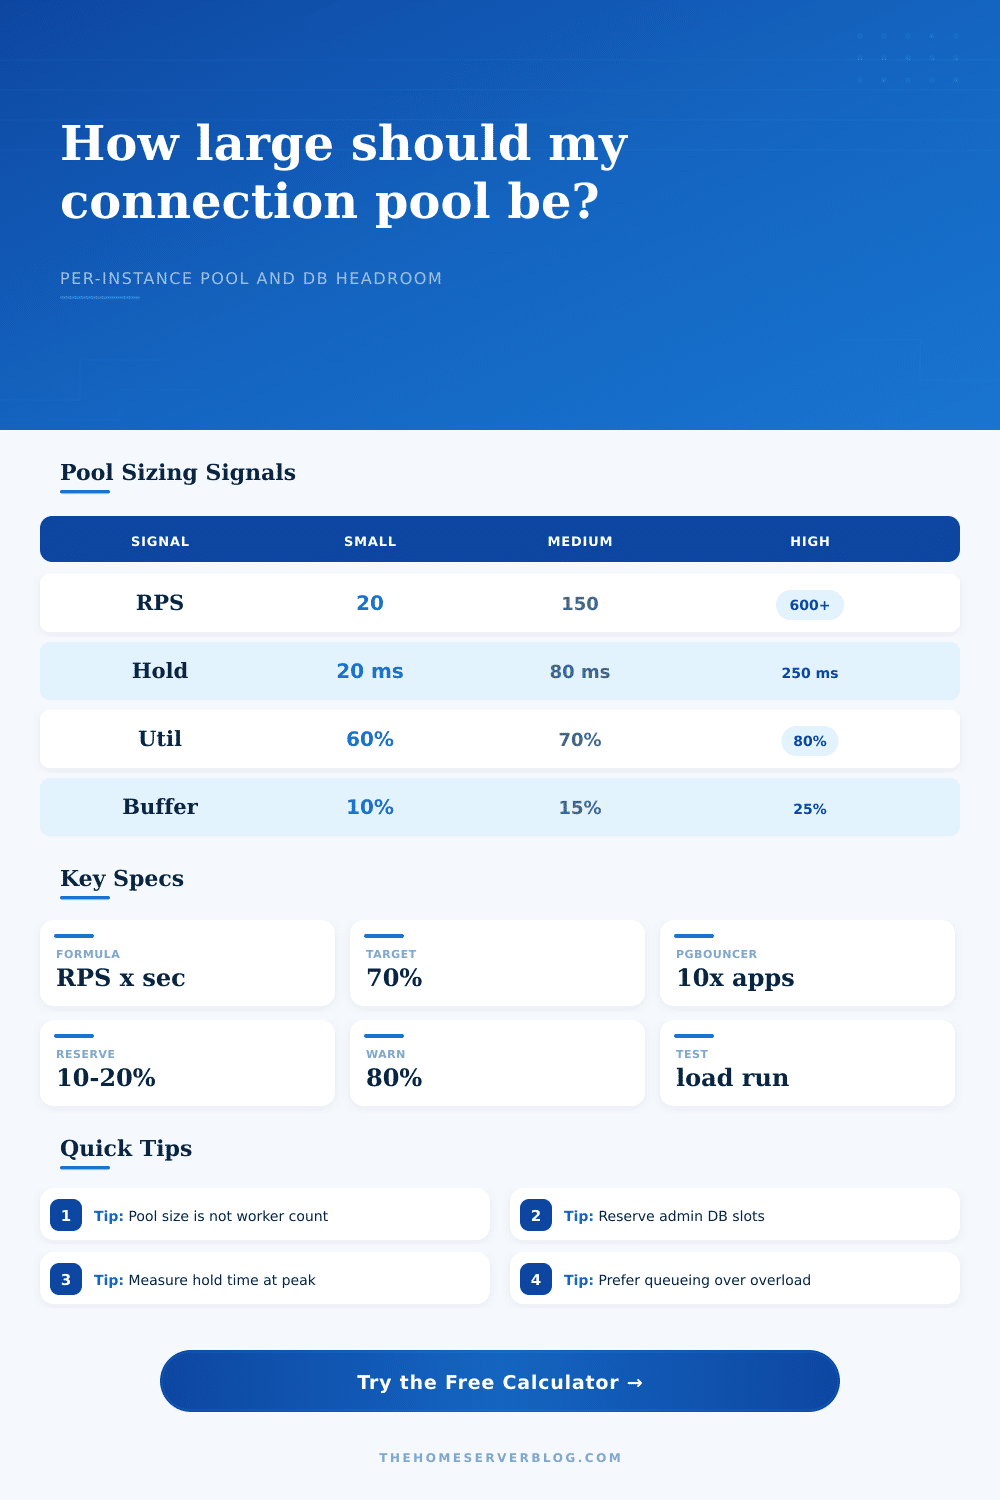
| Pool target | Demand / utilization x buffer | Keeps normal load below 100% so requests wait less often. | Recommended total app pool. |
| Per-instance pool | Ceiling(total pool / app instances) | Turns total connection budget into a setting for each container or process. | Value for maxPool, pool_size, or similar config. |
| Headroom | DB max - reserved - other connections - total pool | Remaining server slots after this application is configured. | Shows whether the DB can accept the plan. |
Traffic pattern burst factors
| Pattern | Burst factor | Typical workload | Pool note |
|---|---|---|---|
| Steady | 1.10x | Daemon, exporter, small internal API. | Smaller buffer is often enough when queries are short. |
| Web/API | 1.35x | Interactive users with uneven page loads. | Good default for a measured home server service. |
| Dashboard | 1.55x | Grafana panels, admin views, report fan-out. | Panel refreshes can arrive in clumps. |
| Cron/queue | 1.80x | Workers start together or batch jobs overlap. | Throttle worker count if DB slots are limited. |
| Spiky | 2.20x | Match stats, alerts, imports, webhook bursts. | Queueing and rate limits may be better than a huge pool. |
Usable DB connection planning
| Database max | Reserve first | App budget target | Home lab interpretation |
|---|---|---|---|
| 50 connections | 8 to 12 | 25 to 35 | Single low-traffic app or small VPS database. |
| 100 connections | 15 to 20 | 55 to 75 | Common PostgreSQL or MySQL default range for small servers. |
| 200 connections | 25 to 40 | 120 to 155 | Good for several containers if query time is controlled. |
| 500 connections | 60 to 100 | 300 to 390 | Needs enough RAM and CPU; poolers usually become attractive. |
| 1000 connections | 120 to 200 | 600 to 780 | Often a sign to use pooling, sharding, caching, or workload isolation. |
Common service sizes
| Service | Peak load | Starting pool | What to verify |
|---|---|---|---|
| Personal blog CMS | 5 to 25 rps | 4 to 10 per instance | Slow plugins and admin page queries. |
| Nextcloud or file portal | 20 to 80 rps | 8 to 20 per instance | Sync bursts, previews, locks, and cron overlap. |
| Home automation API | 50 to 200 rps | 8 to 24 per instance | Event writes and sensor history retention. |
| Grafana or reporting | 20 to 150 rps | 10 to 32 per instance | Panel fan-out and query timeout settings. |
| Side project SaaS | 100 to 800 rps | 16 to 64 per instance | p95 checkout wait under load test. |
ℹPool sizing notes
Until your server started timing out, you probably didn’t think about database connections. When you load up the home automation dashboard, everything work just fine … except when you attempt to switch on the lights. The dashboard spin around like a dog chasing its tail.
And no, it’s not usually the database’s fault. It’s almost never the database. It’s almost always the pool of connection feeding the database. Controlling that connection pool isn’t necessarily about horsepower as much as it is controlling traffic. You have to ensure you’re leaving sufficient lanes open during rush hour traffic, without creating such a wide highway that it clogs down the whole server.
How to Size Your Database Connection Pool
It’s all about balancing the number of concurrent user against the use of resources:
Too few: Applications wait in line. When a slot open up, the system processes it, but the user stares at a loading screen.
Too many: The database eat away at CPU and memory. It keeps track of idle sessions rather than running their queries. The overhead accumulates rapidly.
Every open connection use some amount of resources on the server: sockets, processes, threads, they all cost something. What you’re looking for is an appropriate size that can handle peak demand without exceeding it. The pool need to be large enough to meet demand, but small enough to account for unexpected spikes and administration time.
People typicaly begin with a rounded number, one-hundred, maybe fifty. They never get anywhere because they don’t account for the true shape of traffic. All you have to do is insert the connection hold time and peak request rate. Then the calculator does the work for you. It spares you from having to guess at conversions and coefficients. Instead, you let Little’s Law guide you.
Little’s Law says the number of active connections equals your throughput multiplied by the average time a connection is held. The total hold time is measured. If your app checks out a connection, makes a query, processes the response, and then lets go of the connection, all of that time are considered hold time. A lot of developers believe that query time is hold time. That misconception cause them to underestimate pool size.
Bursts are also key. Traffic isn’t uniformly even. Traffic come in bursts. One user may click on three pages back-to-back, creating a burst. Another cron job that runs a report every hour put additional strain. To accommodate this variation, it apply a burst factor based off the type of traffic. Maybe an internal service is relatively constant, so a little buffer will suffice. Perhaps your public API have spikes that require far more headroom to handle sudden surges without dropping requests. Having a two-point-two factor vs a one-point-one factor completely alters sizing approach.
For example: the server has a limit on how many connections it will accept. Everyone count against this limit, including the application itself, any stray terminal sessions, monitoring agents, backup tools, etc. If your application eats up all the connections, then the server shut you out. You cannot log in to fix the thing that caused the outage. You need reserved spots for admin stuff. It is not optional. It is required for survival.
There’s also a silent constraint: memory usage. Redis connections are lighter than PostgreSQL connections. Fifty Redis clients consume less memory then a pool of fifty PostgreSQL sessions. Depending on your engine choice, the calculator account for this memory overhead. That way, you have an idea of the resources it consumes and whether or not it will run out of gas. If it’s already running hot on RAM, the last thing a server need is a large connection pool.
This isn’t set in stone. This is where you start. Now load test and see how your queries perform. If they’re taking a while to check out, tweak the pool size. If there’s heavy saturation, then tune those slow queries. As the app expand, the numbers change. So continue to measure and adjust. And make sure to leave that buffer room wide open.
Run out of connections? That’s when the lights go off. Don’t let the database go dark. Keep the lights on.