Container CPU Request Calculator
Estimate Kubernetes CPU requests, CPU limits, node fit, and reserved cluster share from throughput, per-request CPU time, replicas, sidecars, and scheduling headroom.
⚙Home lab deployment presets
💻Container CPU inputs
Container CPU request results
▣Equipment and node comparison grid
| Node profile | Raw CPU | Allocatable model | Good fit |
|---|---|---|---|
| Raspberry Pi 5 | 4 cores | 3400m after reserve | Light web apps, DNS, small controllers |
| Intel N100 mini PC | 4 E-cores | 3600m after reserve | Efficient k3s node with many tiny services |
| TinyMiniMicro i5 | 6 cores | 5400m after reserve | Mixed APIs, dashboards, media helpers |
| Ryzen 5 5600 | 12 threads | 10800m after reserve | Busy home lab node or single-node cluster |
| Used EPYC node | 32 threads | 28800m after reserve | Dense VM plus container lab with heavy workers |
| Three-node k3s cluster | Mixed | 10500m combined | Spread replicas across small always-on nodes |
📊Workload CPU demand reference
| Container workload | Starting CPU request | CPU time model | Limit guidance |
|---|---|---|---|
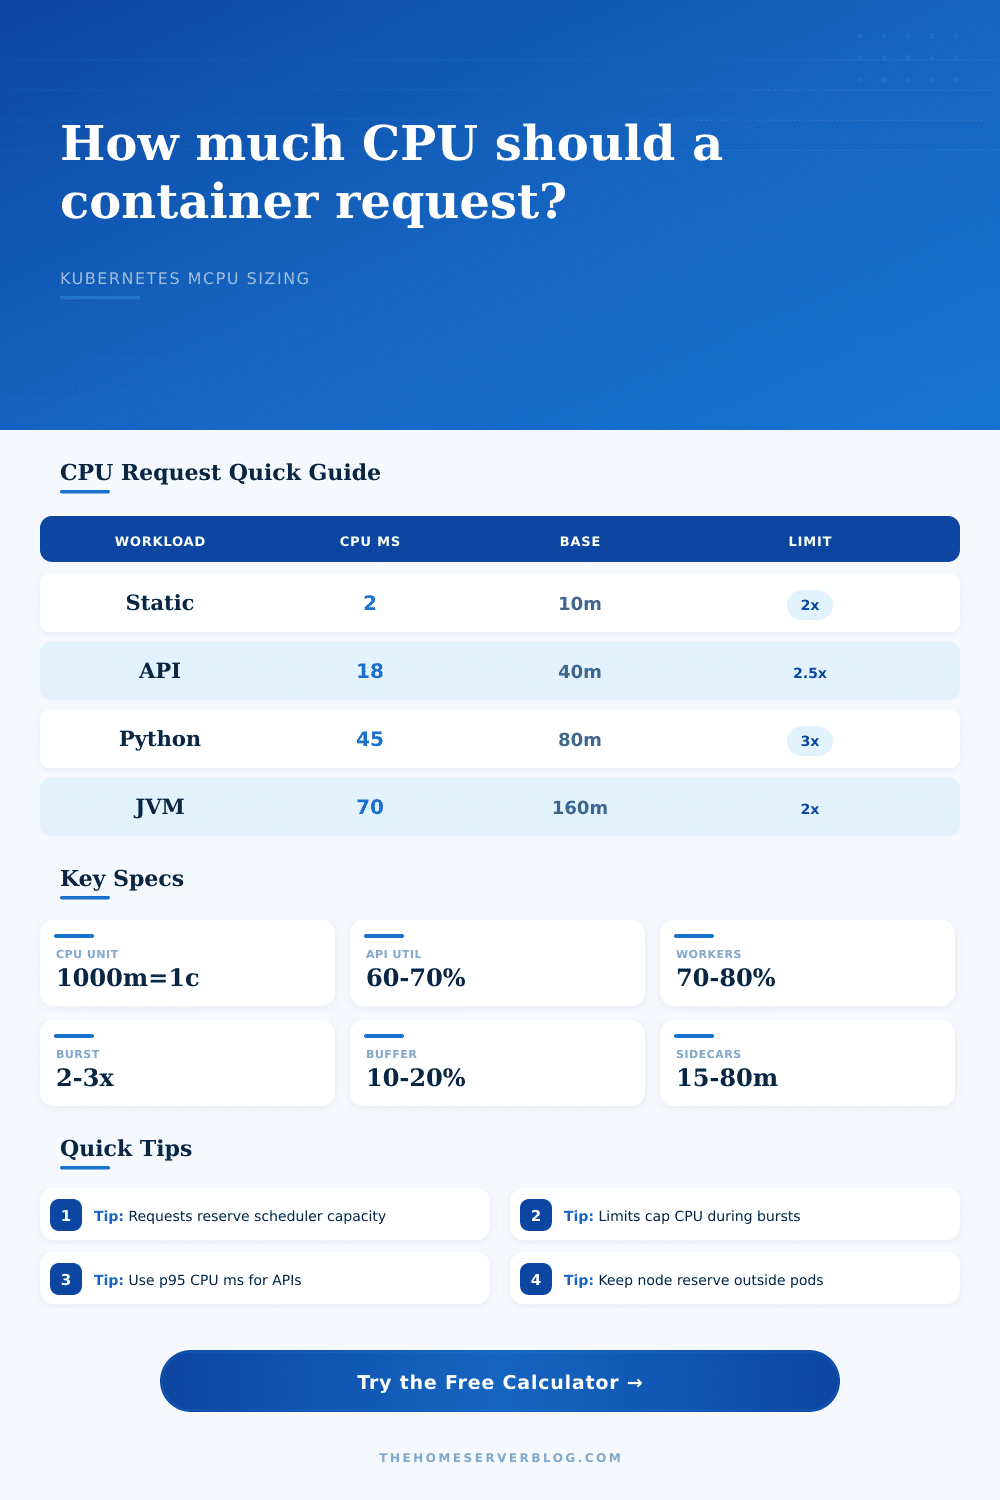
| Static web container | 10m to 40m per pod | 1 ms to 5 ms per request for cached content | 2x request is usually enough unless compression is heavy |
| Reverse proxy or ingress | 25m to 80m per pod | 3 ms to 12 ms per routed request | 2x to 3x request for TLS and routing bursts |
| Node or Go API | 40m to 150m per pod | 10 ms to 35 ms per request for typical home apps | 2x to 2.5x when latency matters |
| Python automation API | 80m to 250m per pod | 25 ms to 80 ms per request or task | 2.5x to 3x for interpreter and library spikes |
| JVM or search service | 160m to 600m per pod | 40 ms to 120 ms per request plus warmup | 1.5x to 2x with profiling and stable heap |
| Metrics collector | 100m to 500m per pod | Scrape and rule CPU rises with targets and retention | 2x if queries and recording rules run together |
| Background worker | 100m to 1000m per pod | Job CPU divided across queue concurrency | 1.5x to 2.5x depending on deadline slack |
| Build or CI runner | 500m to 4000m per pod | Often bounded by compiler parallelism | Limit close to intended parallel job CPU |
📘Kubernetes request and policy reference
| Policy | Request formula | Limit multiplier | Practical use |
|---|---|---|---|
| Tiny always-on service | Idle plus low steady CPU, then 10 percent buffer | 3.0x request | DNS, homepage, tunnel, webhook receivers |
| Balanced Burstable | Load divided by 65 percent target utilization | 2.5x request | Most home APIs and dashboards |
| Guaranteed pod | Request and limit intentionally close | 1.0x request | Stable workloads where throttling is preferable to noisy bursts |
| Batch or worker queue | Load divided by 75 percent utilization target | 2.0x request | Media tasks, import jobs, nightly automation |
| Low-latency API | Load divided by 55 percent utilization target | 2.0x request | Interactive apps where tail latency matters |
🗂Common home lab project sizes
| Project | Typical replicas | CPU request range | Capacity note |
|---|---|---|---|
| Homepage plus uptime monitor | 1 to 2 pods | 25m to 100m per pod | Fits almost anywhere, but probes can dominate CPU |
| Ingress controller with TLS | 2 pods | 80m to 250m per pod | Leave burst limit for certificate and TLS spikes |
| Self-hosted notes or wiki | 2 to 3 pods | 120m to 400m per pod | API and database proxy sidecars raise idle CPU |
| Prometheus and exporters | 1 to 2 pods | 250m to 800m per pod | Scrape interval and query load matter more than replicas |
| Media indexer workers | 1 to 4 pods | 500m to 2000m per pod | Use limits to stop jobs from flattening the node |
| CI runner pool | 1 to 6 pods | 1000m to 4000m per pod | Match limit to the parallelism you actually want |
ℹCalculation notes
Formula used: steady workload mCPU = throughput multiplied by CPU milliseconds. The calculator divides that by target utilization, adds idle and sidecar mCPU for every replica, applies the selected buffer, then rounds the per-pod request to clean Kubernetes-friendly increments.
Your new service deploys to your home lab without any problems. It works great for a few hours, but then there’s a traffic spike or a nightly backup job and things slows down on your node. 9 times out of 10, it’s not the hardware. It’s typically the way scheduler gave you not enough CPU for your pod.
For most people, Kubernetes CPU requests is treated as static hardware slots. They’ll give each of their containers a flat value and cross their fingers. That breaks down in two scenarios: when services gets throttled or resources go to waste. What you’ve mixed up is that the process doesn’t do what scheduler sees. A Kubernetes request isn’t a guarantee of dedicated CPU time. It’s a request for scheduling capacity. By setting a request, you’re asking cluster to reserve capacity for you; even while you sit idle. Limits are an actualy measure of consumption and is a hard ceiling. The kernel will throttle your pod when it exceed this limit.
How to Set CPU Requests and Limits in Kubernetes
What you need to know is what it’s measuring. Do you set a request so high as to starve other workload? Do you set a limit too low such that your API gets sluggish during small spikes? What about comparing a Java app to a static website? Running a simple Nginx container that serves cached images take two milliseconds of CPU for each request. The same operation on a JVM-based service would of took seventy milliseconds. It also uses a lot of resources while idling because background threads and garbage collection processes is running. Sizing them the same way will either mean you’re over-provisioning your static site or under-provisioning your Java app.
You can let the calculator do the math (you just have to give it the data). First, measure how much CPU it use per request, not just what its average load is. Say your API gets 50 requests a second and spends 20ms doing some compute per request. That’s about a thousand millicores. Add some extra for latency tolerance or sidecar buffers, that will support your load. Lots of admins do neither; they’ll estimate based off solely the kind of container. This results in instability.
Second, consider quiet hours. Your process will consume CPU even when there aren’t requests. Telemetry exporters, health checks, and event loops all still draw power. If you don’t consider your idle baseline, your actual minimum workload will be higher than your requests.
What are millicores? And then there’s Node capacity. Each Raspberry Pi 5 core can do something, but you still need some of it for the operating system and kubelet. Even though that is a four-core Raspberry Pi, the raw specs does not matter much. It will usually only have about three thousand four hundred millicores available for pods. The “usable scheduling units” section on the page translates various hardware profiles into those terms.
Why does this matter? Oversubscribing makes it impossible for the system to cope. If you set up pods requesting three thousand eight hundred millicores when you only have three thousand four hundred free on your node, you create a physical impossibility.
Lastly, think about how the work bursts. Some workloads aren’t even smooth. Maybe a background worker processes a queue, sitting idly for minutes at a time before spiking to full capacity. Or perhaps you have a web API that must react quickly and be both smooth and predictable. The difference should show in how you size things. Size the worker conservatively so that it doesn’t flatten your node. Give the API more head room so it can absorbs unexpected traffic spikes without throttling.
More than anything, it’s not so much getting the precise number right as it is establishing the bounds of what is an acceptable performance. Get your requests right and your scheduler does its thing for you. Get your limits wrong and now you’re fighting your infrastructure.