HomeServerBlog cooling resilience planner
Cooling Redundancy Calculator
Size redundant cooling for a server closet, home lab rack, micro data room, or edge pod from total heat load, cooler capacity, unit count, N+1/N+2/2N mode, derate, maintenance, failure assumptions, diversity, growth, and target reserve.
1Redundancy presets
2Cooling, load, failover, and margin inputs
Cooling redundancy breakdown
Reserve health indicator
3Reserve, failover, units, and capacity cards
Diversified heat load plus growth allowance before reserve is checked.
Extra cooling units implied by N+1, N+2, or 2N topology.
Maintenance and failure units removed from usable failover capacity.
Additional cooling units needed to satisfy mode and reserve together.
4Topology comparison grid
N baseline
Installed units meet the calculated load but do not reserve a complete spare unit.
0 unitsN+1
One complete unit can be lost while the remaining cooling plant still covers load.
0 unitsN+2
Two spare units support overlap between maintenance work and one surprise failure.
0 units2N
A duplicate cooling path covers the full planned load when one side is unavailable.
0 units5Cooling redundancy reference tables
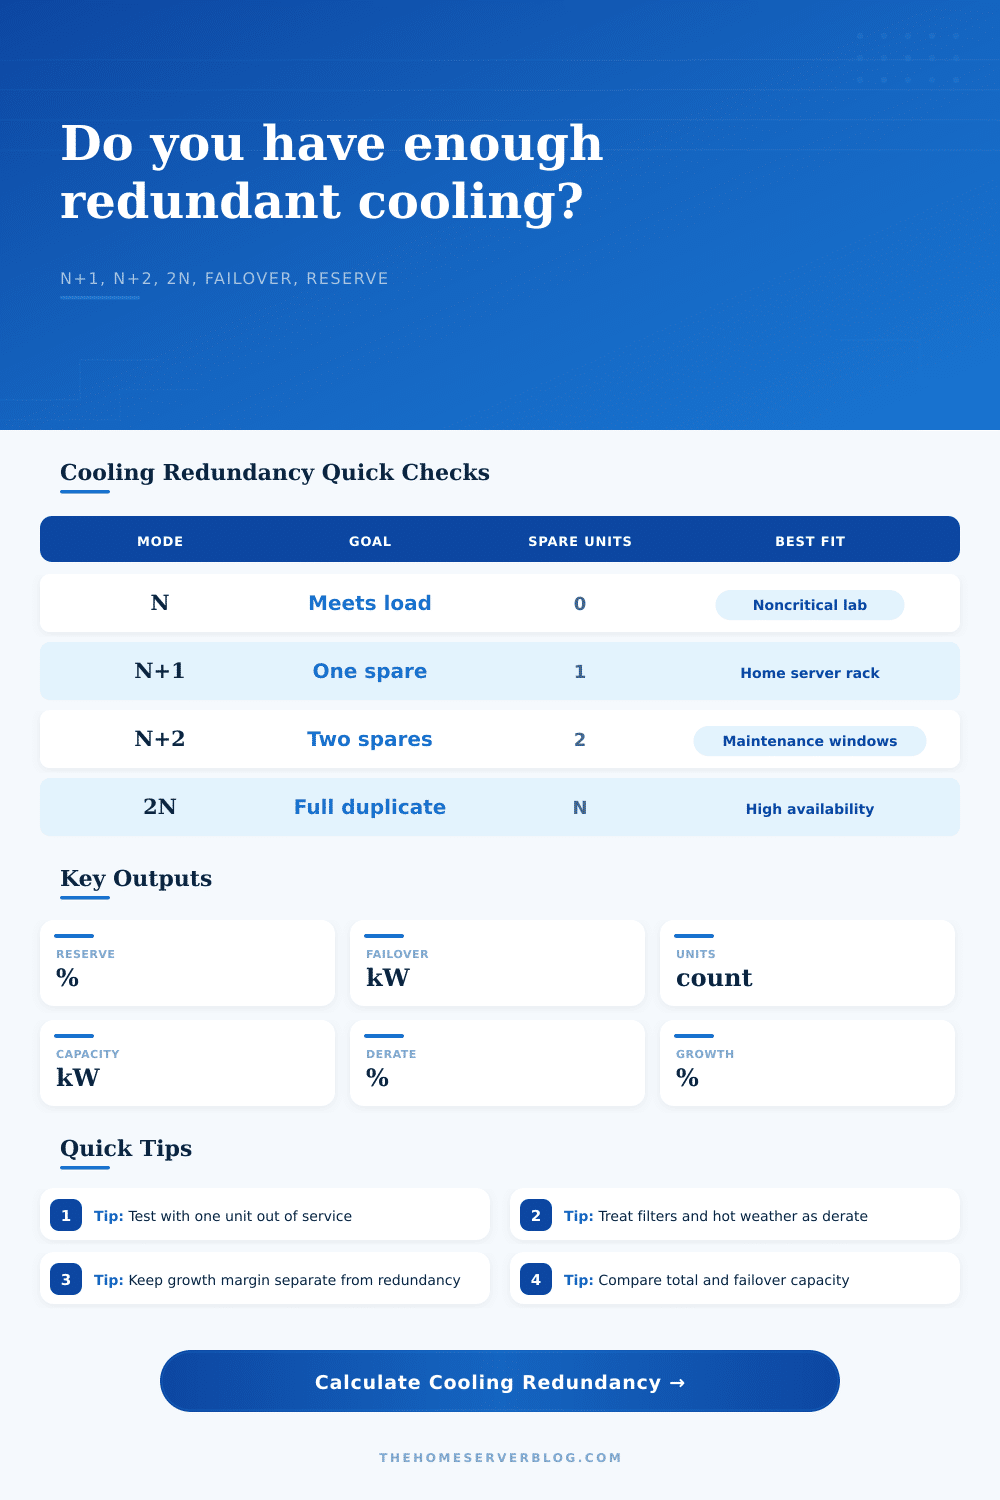
Redundancy mode planning table
| Mode | Unit logic | Typical use | Watch point |
|---|---|---|---|
| N | Enough active units to meet planned load | Noncritical lab cooling or temporary rooms | No spare unit |
| N+1 | Base units plus one complete spare | Most home server racks and small machine rooms | One failure |
| N+2 | Base units plus two complete spares | Maintenance overlap or less trusted units | Two-unit event |
| 2N | Two full sets of required cooling | High availability edge rooms and business-critical pods | Path separation |
Derate inputs to consider
| Derate source | Common planning range | Why it matters | How to improve |
|---|---|---|---|
| High outdoor ambient | 5% to 25% | Mini-splits and condensers lose capacity in severe heat | Shade condensers and keep coils clean |
| Dirty filters or coils | 5% to 20% | Airflow restriction cuts sensible cooling delivery | Use a dated cleaning and filter schedule |
| Long line sets or ducts | 3% to 15% | Pressure drop and refrigerant limits reduce practical output | Verify design length and static pressure |
| Altitude or poor room mixing | 5% to 18% | Lower air density and short cycling hide real load | Measure rack inlet and return temperatures |
Reserve interpretation table
| Reserve after failover | Status | Meaning | Practical next step |
|---|---|---|---|
| Below 0% | Shortfall | Modeled offline units leave less cooling than planned load | Add capacity, reduce load, or lower the outage assumption |
| 0% to 10% | Tight | Capacity may work but gives little room for heat waves or filters | Increase target reserve or derate more honestly |
| 10% to 25% | Usable | Good small-room planning range for steady loads | Confirm with a controlled failover test |
| 25% and up | Comfortable | Healthy margin if airflow paths are also separated | Keep maintenance records and monitor inlet sensors |
Failure and maintenance scenario table
| Scenario | Offline units | Calculator fields | Good planning habit |
|---|---|---|---|
| Filter change on one cooler | 1 planned | Maintenance offline units = 1, failure units = 0 | Schedule during low IT load |
| One unexpected unit failure | 1 unplanned | Maintenance offline units = 0, failure units = 1 | Alert on room and rack inlet temperature |
| Maintenance plus failure | 2 total | Maintenance offline units = 1, failure units = 1 | Use N+2 or defer maintenance |
| A-side cooling path outage | Half the plant | Use 2N mode and compare topology grid | Keep power, drain, and controls separated |
6Cooling redundancy tips
There’s a kind of panic that only server admins know all too well. It occurs typicaly on a Tuesday afternoon, when the air conditioning goes down. The room start getting warm, and the servers begin to heat up. You realize there’s no backup plan; there’s no spare capacity.
That’s where this cooling redundancy calculator comes in. Before the air conditioner realy breaks, it models the math of breakdown to show you what your cooling system is capable of doing on a perfect day versus what it needs to be able to do when things go wrong.
Why Cooling Redundancy Matters for Your Servers
People tend to size their cooling for good weather. They figure out how many watts their gear puts off, tack on a few for safety, and purchase sufficient unit to account for it. This results in an N baseline. As long as nothing go wrong with those filters and one doesn’t blow a hose, that’s all fine and dandy.
Once you input your unit specs and heat load, the calculator does the math. No more wondering if you’re covered for maintenance, you have extra capacity. The heavy lifting is figuring out how you want to define a failure given your system. Are you prepared for a planned filter change while losing power? Or do you plan to cover a complete failure?
Why use these inputs? Because they’re real-world inputs. You’ll also notice the derate field. Units are rated for cooling in an ideal lab environment. It’s not your server room. Dirty coils, high ambient temperatures, long refrigerant lines, bad air mixing, these all decreases a unit’s effective output. A 12% derate means accepting that the unit won’t produce as much as claimed on its nameplate. This is an honest assumption. Disregard it at your own peril; disregard it and you risk thermal runaway.
There are multiple levels of redundancy modes (cost vs. Comfort). N plus one is one spare unit. That’s enough to pick up the load if one goes down. N plus two allows for overlapping maintenance buffers. Two N is fully redundant. As you’ll see in the reference table, more redundancy equals more power and hardware. But it also buys you resilience.
How much downtime can you afford? A home lab might survive a warm weekend. No. But an edge pod used in a business critical way? No.
Finally, there’s the issue of growth margin. Over time servers warms up. You’ll buy new processors, add drives, perhaps GPU cards. If your cooling is precisely tuned for what you have now, you can’t fit anything else in. Growth vs. Redundancy: this is where the calculator draws a distinction. Adding an extra server to stay cool enough for next year’s workload doesn’t mean you’re redundant, it means you need the capacity anyway.
The best way to test your assumptions is to test them. You can draw up a failure scenario on paper, but the air will tell you the truth. When it’s quiet, turn off one of the cooling units and monitor the inlet temps for the rack. Do those spike? Then your reduction or diversity factor assumption are too optimistic. Tweak the numbers, run it again.
It’s not about getting a perfect score in a spreadsheet. It’s about knowing that when the compressor fails, the other part of the system stays cool. Yes, it’s about cooling. But more importantly, it’s about reducing the risks associated with cooling.
That’s what it means to manage risk: you’re making a bet about the future. How many people will be using this system? What kind of maintenance schedule do I need to use? What are my failure rates? The tool helps you make that bet confidently. It turns abstract “feelings” of anxiety into real measures of capacity.
After you model an outage, you’ll know precisely how much headroom you’ve got. Does your n plus one strategy buys you one spare unit or simply some margin for error?
All this means that redundancy is insurance. Insurance in electricity and hardware. It is insurance that you pray you never have to use. But then the day comes and the heat is on. The units trip, and those who planned for the worst day remain cool. Meanwhile, the rest of us look on as the servers trip their thermal breakers.
Pick your redundancy carefully. Test it regularly. And never believe a nameplate rating until you see the derate.