Cox Data Usage Calculator
Forecast monthly data from streaming, work calls, cameras, gaming, downloads, backups, and your current billing-cycle pace.
Monthly Data Forecast
Projected GB = current meter + remaining-day forecast + one-time downloads + one-time backups + network overhead. Usable allowance = monthly allowance + extra block - safety buffer.
| Activity | Calculator Rate | Why It Matters | Monthly Example |
|---|---|---|---|
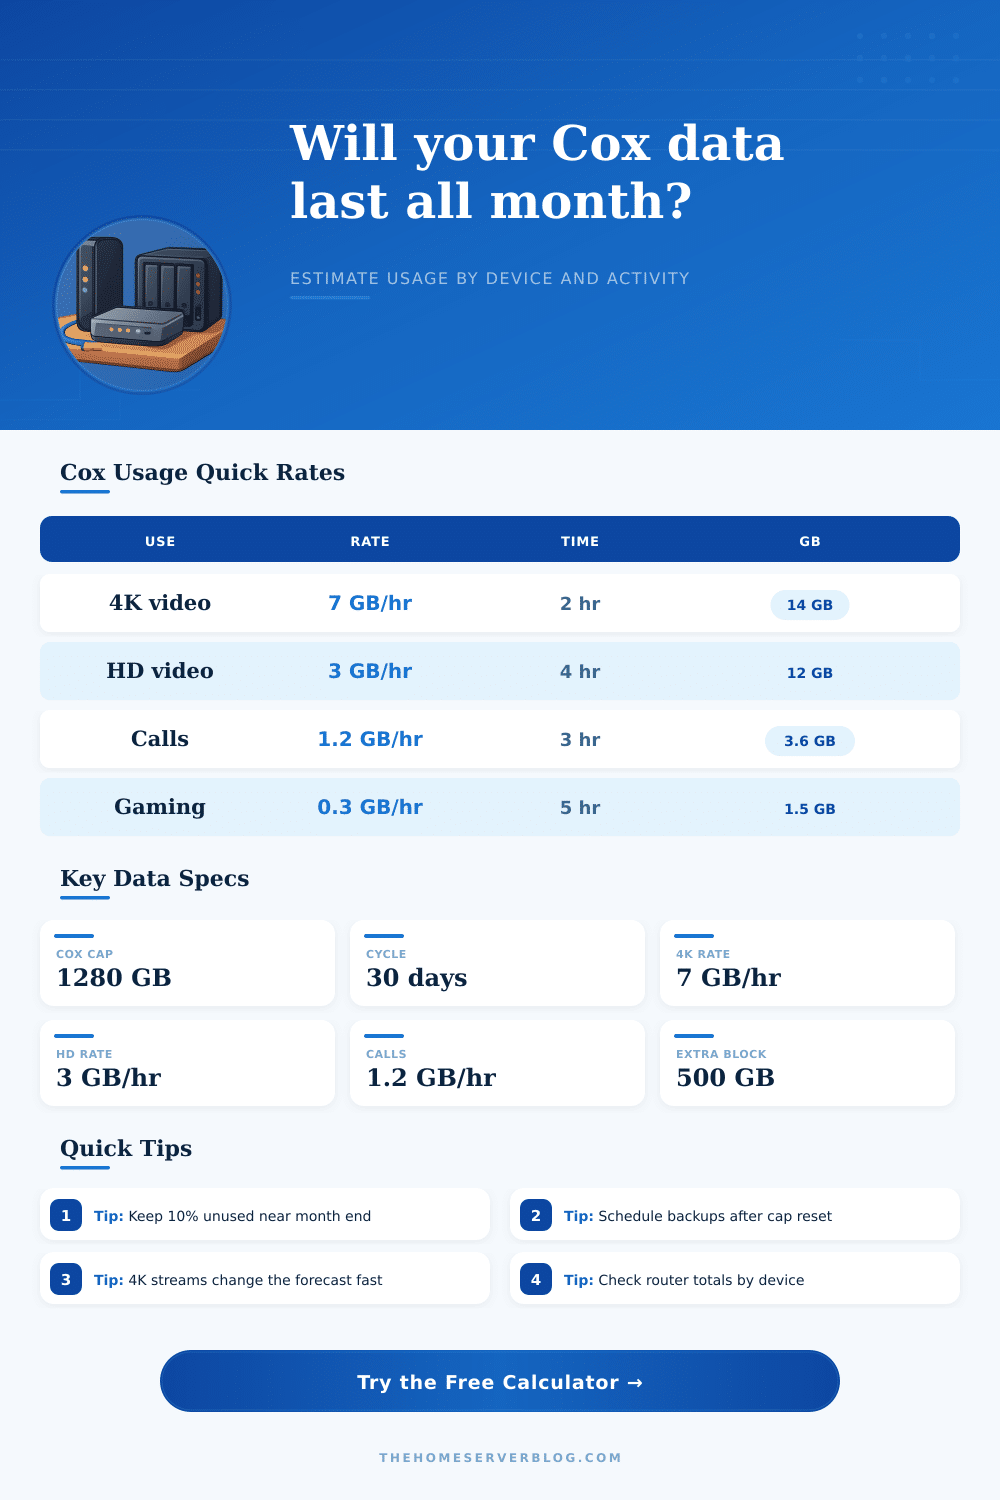
| 4K streaming | 7 GB per hour | Largest common household driver | 2 hr/day = 420 GB |
| HD streaming | 3 GB per hour | Multiple TVs add up quickly | 3 hr/day = 270 GB |
| Work video calls | 1.2 GB per hour | Weekday-heavy usage pattern | 3 hr/workday = 79 GB |
| Online gaming | 0.3 GB per hour | Gameplay is small beside downloads | 3 hr/day = 27 GB |
| Cloud camera uploads | 1.5 to 16 GB per camera/day | Always-on upload can surprise users | 2 cams at 4 GB/day = 240 GB |
| Plan Scenario | Allowance Used Here | 10% Buffer Target | Average Daily Budget |
|---|---|---|---|
| Base Cox data plan | 1,280 GB | 1,152 GB usable | 38.4 GB/day over 30 days |
| Base plan, no buffer | 1,280 GB | 1,280 GB usable | 42.7 GB/day over 30 days |
| Base plus 500 GB | 1,780 GB | 1,602 GB usable | 53.4 GB/day over 30 days |
| Short 28-day cycle | 1,280 GB | 1,152 GB usable | 41.1 GB/day with buffer |
| Network Setup | Typical Device Mix | Data Risk | Calculator Adjustment |
|---|---|---|---|
| Wired-heavy router | Desktop, NAS, smart TV on Ethernet | Lowest retry overhead | 0.95 network factor |
| Balanced home network | Ethernet backhaul plus Wi-Fi clients | Normal home usage | 1.00 network factor |
| Mesh Wi-Fi home | Many phones, tablets, TVs, consoles | More retransmits and sync traffic | 1.08 network factor |
| Congested Wi-Fi | Weak signal, old clients, busy band | Higher retry overhead | 1.15 network factor |
| Household Pattern | Major Drivers | Typical Monthly GB | Planning Note |
|---|---|---|---|
| Light apartment | HD video, phones, laptop backups | 250 to 500 GB | Usually below the base cap |
| Remote work family | Calls, HD video, school devices | 650 to 1,050 GB | Watch the final week pace |
| 4K entertainment home | Two TVs, game downloads, tablets | 1,000 to 1,600 GB | Quality settings matter most |
| Camera and NAS home | Cloud cameras, sync, media server | 900 to 1,800 GB | Uploads can be the hidden driver |
Many people does not think about their data allowance until the end of their billing cycle. Most people only think about their data allowance if their internet speed decreases or their data meter increase. People dont typically think about their data allowance because they do not have an understanding of the amount of data that different activities use.
A Cox data usage calculator can help people understanding how much data they will use during their data plan cycle. The calculator allows people to forecast their data usage so that they can adjust their data consumption habit early in their data plan cycle. The data input into the data calculator represents different data consuming activities within a household.
How to Use a Data Usage Calculator to Plan Your Home Internet
For example, the amount of hours that a person streams video will be an input into the data calculator. The amount of time that a person use video calling services will be another input into the data calculator. The number of security camera within a house and the number of security camera upload profiles is another data input into the calculator.
The amount of data that is transmitted by device within a household while they are performing background tasks is another data input. Each of these data inputs can be altered to represent a change in the behavior within the household; for example, altering the video quality that is used will change the amount of data that is transmitted by the household each month. Each of the output numbers from the data calculator provide information to the household about the data consumption plan.
For example, the projected amount of data that will be used is an output from the calculator. The remaining amount of data that can be used after reaching the data plan allowance is another output from the data calculator. Finally, the amount of data that must be used each day for the remainder of the data plan cycle is another output from the data calculator.
If the amount of data that is determined each day is less than the amount of data that is typically used by the household, then the household can continue to use data without concern of exceeding their data allowance. However, if the amount of data that is to be used each day is greater than the amount of data that is typically used by the household, then changes must be made to the habit of the household to ensure that they will not exceed their data plan allowance. Small differences in the amount of data that is used by a household can significantly impact the amount of data that is used each month.
Small differences in data usage can lead to the household exceeding their data allowance. For example, if a household use one hour of 4K video each day, that one hour of data will use a significant amount of data each month. Similarly, if large amounts of data are used to download games or back up files to the cloud, the amount of data that is used will be more significantly high for that month.
However, the data calculator allows people to separate these different data uses so that they can determine when to perform these data heavy task. For example, people can determine that performing the game download or file backup will occur at the beginning of the next data plan cycle so that the data will not impact their current data allowance. The data calculator accounts for different data network conditions within the household.
For example, if the data network within the house is extreme congested or utilizes a mesh network, the amount of data that is used by device within that house will increase. This overhead data within the data calculator can allow people to account for these conditions within the house, allowing them to better understand why their data may be increasing during their current data plan cycle. For example, if a household has all of their devices connected to the network wirelessly, they will use more data than a household that has all of their devices connected directly to the network via a wire.
People should utilize the data calculator to form a data consumption plan for their household, and they should use the data calculator throughout the data plan cycle. At the beginning of each data plan cycle, the user should start the data calculator to form a plan for the data that will be used during that cycle. Around the middle of each data plan cycle, the calculator should be started again to compare the actual amount of data being used to the amount that was projected at the beginning of the data plan cycle.
If the amount of data that is being used is greater than the amount that was projected at the beginning of the cycle, the video quality within the house can be reduced or the downloads of large file can be postponed. However, if the amount of data that is being used is less than the amount that was projected at the beginning of the cycle, then the habits of the individuals in the household is within their data allowance. Many people may make mistakes in their data management if they treat all data uses as the same.
For example, individuals that watch HD video will use less data than individuals that watch 4K video. Therefore, an individual that watches HD video for four hours will use less data than an individual that watches 4K video for four hours. Another data use that can consume a significant amount of data is the use of security cameras within a house.
These security camera continuously use data even if the individuals within the house are not using the internet to view the security cameras. This data use can be accounted for in the data calculator. The goal in determining the amount of data that will be used within a cycle is not to use zero data within that cycle.
Instead, having a margin of data within the data plan cycle allows a household to avoid stress if they must download additional data or watch additional video during that cycle. Thus, a large remaining data balance within the data calculator indicate that there is a comfortable margin for the household within that cycle. However, if there is a thin margin within the cycle, then the people within the house have time to change their data allowing habit before the new cycle begins.
By using the data calculator, people can avoid the development of data-related problems altogether.