HomeServerBlog virtualization sizing tool
CPU Overcommit Ratio Calculator
Estimate vCPU overcommit ratio, effective host capacity, ready-time risk, and safe vCPU allocation from physical cores, SMT threads, VM demand, hypervisor reserve, latency-sensitive VMs, target ready time, and safety buffer.
CPU scheduling breakdown
SMT credit
1.55xThreads add scheduling slots, but the extra sibling thread is discounted because it does not equal a full physical core.
Reserve removed
12%Host management, storage interrupts, backup agents, and migrations should keep dedicated CPU room.
Peak pressure
72%Peak demanded cores divided by effective scheduling capacity before the safety buffer.
vCPU headroom
10Difference between safe vCPU allocation and current assigned vCPU count.
| Band | Typical ratio | Good for | Watch closely |
|---|---|---|---|
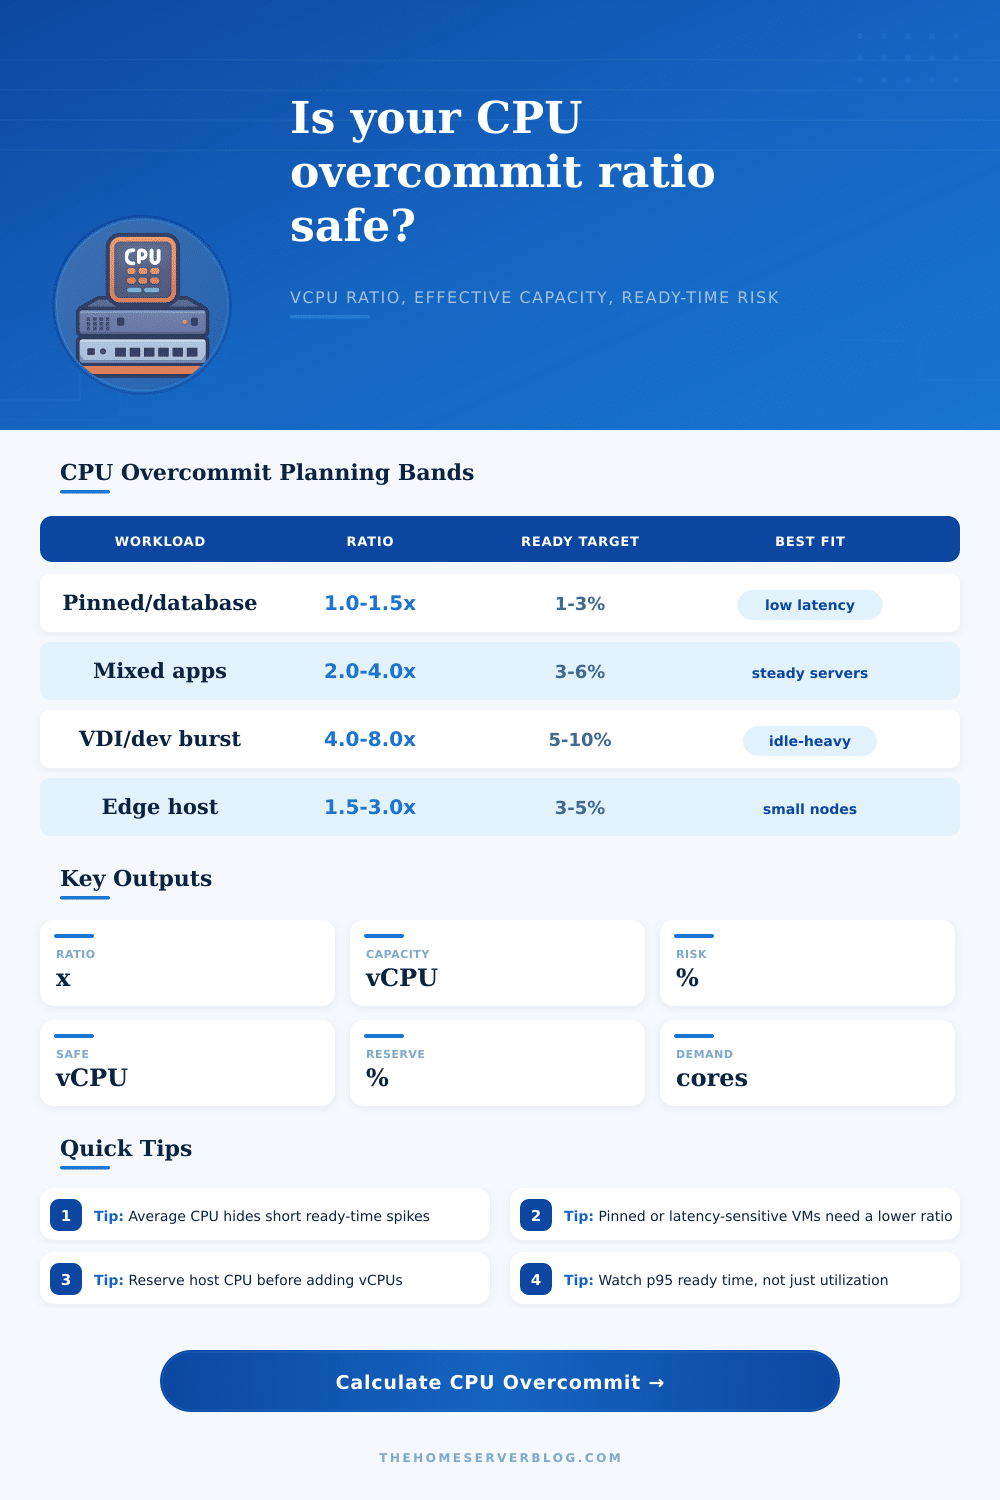
| Reserved | 1.0x to 1.5x | CPU-pinned workloads, databases, real-time voice, storage nodes | NUMA boundaries, co-stop, host reserve, pinned placement |
| Conservative | 1.5x to 3.0x | Production app VMs with moderate peaks and predictable schedules | Backup windows, live migration, noisy neighbors, p95 ready time |
| Balanced | 3.0x to 5.0x | Mixed home lab, internal tools, Kubernetes worker nodes | Peak overlap, CPU limits, storage interrupt spikes |
| Burst-heavy | 5.0x to 8.0x | VDI, dev labs, idle-heavy test VMs, student labs | Morning boot storms, patch waves, compile jobs, login storms |
| Speculative | 8.0x+ | Mostly powered-off or deeply idle lab inventory | Any sustained CPU load can produce high ready time quickly |
| Preset | Cores / threads | Assigned vCPU | CPU pattern | Ready target |
|---|---|---|---|---|
| Proxmox Home Lab | 12 cores / 2 threads | 48 vCPU | 18% average, 55% peak | 5% |
| VMware Cluster | 32 cores / 2 threads | 140 vCPU | 22% average, 62% peak | 4% |
| Kubernetes Nodes | 16 cores / 2 threads | 64 vCPU | 28% average, 70% peak | 6% |
| VDI Pool | 24 cores / 2 threads | 180 vCPU | 12% average, 48% peak | 8% |
| Database VM Host | 24 cores / 2 threads | 48 vCPU | 45% average, 82% peak | 2% |
| Mixed App VMs | 20 cores / 2 threads | 80 vCPU | 24% average, 58% peak | 5% |
| Burst Dev Lab | 16 cores / 2 threads | 112 vCPU | 10% average, 65% peak | 10% |
| CPU-Pinned Workloads | 16 cores / 1 thread | 20 vCPU | 55% average, 90% peak | 1.5% |
| Edge Mini PC Host | 6 cores / 2 threads | 20 vCPU | 20% average, 60% peak | 5% |
| Platform / policy | Overcommit posture | Controls to use | Ready-time signal | Best practice |
|---|---|---|---|---|
| Proxmox VE / KVM | Flexible; easy to assign more vCPUs than physical cores | CPU type, NUMA, cgroups, CPU units, affinity, host reserve | Run queue, steal time, VM latency, host load average | Keep storage and network services outside the contested CPU pool when possible. |
| VMware ESXi / vSphere | Mature scheduler with strong visibility | Shares, limits, reservations, DRS, latency sensitivity, CPU affinity | CPU Ready %, Co-Stop %, usage MHz, contention | Avoid oversized SMP VMs; right-size before adding more host cores. |
| Hyper-V | Good consolidation, but reserve planning matters | Relative weight, reserve, limit, NUMA spanning, host reserve | CPU wait, hypervisor logical processor utilization | Reserve enough parent partition CPU for storage, backup, and networking. |
| Kubernetes on bare metal | Depends on requests, limits, and CPU manager policy | CPU requests, limits, quotas, static CPU manager, topology manager | Throttle time, run queue, pod latency, node CPU pressure | Do not treat CPU limits as capacity planning; compare requests with actual usage. |
| XCP-ng / Xen | Predictable with careful vCPU placement | vCPU count, weight, cap, pinning, pool scheduling | Credit scheduler wait, dom0 load, guest latency | Protect dom0 and avoid wide VMs on small hosts. |
| Input | Calculator effect | When it raises risk | Practical adjustment |
|---|---|---|---|
| Physical cores | Sets the real baseline for ratio and demand capacity | Small hosts with wide VMs run out of simultaneous execution slots | Add cores, split workloads, or reduce large VM vCPU counts. |
| Threads/core | Adds discounted SMT capacity rather than full extra cores | CPU-bound workloads share execution resources on sibling threads | Use 1 thread/core for strict latency or pinned workloads. |
| Total vCPUs assigned | Controls the headline overcommit ratio and demand pool | High assignment with high peak CPU produces ready-time pressure | Right-size VMs that show consistently low CPU usage. |
| Average and peak VM CPU | Model normal load and burst overlap separately | Peak demand approaches effective capacity, even if average is low | Use p95 or busiest-hour measurements for the peak field. |
| Hypervisor reserve | Subtracts CPU for host, storage, networking, and management | Reserve is too low on storage-heavy or software-defined hosts | Increase reserve before backup, replication, or migration windows. |
| Latency-sensitive VM count | Adds penalty and lowers safe overcommit tolerance | Many sensitive VMs contend with broad bursty VMs | Pin, reserve, or isolate those VMs on less crowded cores. |
| Target ready time | Sets how much scheduling wait the result can tolerate | Strict targets make high overcommit unsafe quickly | Use 1-3% for databases and real-time, 5-10% for labs or VDI. |
| Safety buffer | Removes additional capacity before safe allocation is calculated | Low buffer on hosts with maintenance spikes or noisy neighbors | Use 10-20% for mixed production, more for small edge nodes. |
This calculator is a planning model. Validate the result with actual hypervisor metrics such as CPU ready, co-stop, steal time, run queue length, throttling, and application latency during the busiest window.
Every time we’ve built out a homelab, at some point we’ve discovered that physical cores are not cheap and virtual cores is free. Suddenly you have 12 real cores and you’d like to spin up 32 VMs because who cares yet? This calculator helps avoid the guesswork of whether you’re creating cluster-efficient machine or a noisy-neighbor nightmare. It take raw specs about your hardware and turns them into a clear risk assessment. It does the math for you once you input your hardware specs in the calculator.
So far so good, that’s an easy-to-grasp concept. You can measure the overcommit ratio in terms of number of virtual CPUs assigned versus the number of physical threads available. If it’s 1:1, each VM has its own slice of metal. If it’s 4:1, four VMs is scrapping for the use of one core.
Understanding CPU Overcommitment Risks
Here’s where the trouble comes in: folks treat it as if it’s a fixed thing. It’s not. It’s completely dependent on nature of what the VMs are doing. You can massively overcommit when your VMs are running a file server with only ten percent of their capacity used … but not when they’re running database engine with eighty percent of their capacity being used.
And it’s all about peak demand. If you see your host operating at an average of 20% and think that bumping up the number of vCPUs will be fine, you’re wrong. When everybody logs in at once or every VM back up, the scheduler falls behind and kills latency. This is where ready time gets you. Ready time is how long a virtual CPU has to wait in line before it actualy gets its shot at real processing power. Short, sharp spikes can hide behind low average usage, killing latency.
Effective capacity is what the tool removes from reserve for accounting and host management, while adjusting for SMT thread efficiency (those sibling threads can help with throughput, not necessarily latency-sensitive stuff). What sort of applications will run on your metal? Database- or pinned apps? Those things wants conservative ratios; near to one-point-five. They are not happy waiting for access to the hardware, it has to be deterministic.
Mixed app servers? Maybe three-to-four times overcommit is OK; web requests tend to be asynchronous and is tolerant of slight delay. Development labs or virtual desktop infrastructure are different types of workload altogether. Users can sit idle in between bursts of activity, allowing aggressive consolidation (up to eight times overcommit). This is a balance between responsiveness and density.
That’s what the calculator models, where to enter both peak and avg. It refers to the CPU %. Why? Because if all you look at is averages, then you’re doing capacity planning wrong. Your capacity must have headroom for worst case. Not just the most common. When your peak load exceeds your effective scheduling capacity (which includes other factors like migration & maintenance), you’re screwed.
That’s why there’s a safety buffer input to account for measurement error, migrations, and maintenance spikes. A single large VM will otherwise starve the rest of your system. Another major thing is the host reserve. The hypervisor require some of the CPU cycles for its own use (for example management agents, networking stacks and storage interrupts). Run too many VMs on your guests and they will start choking the host itself. Network packets gets dropped and disk I/O stalls. It is a silent killer that looks like an app failure until you look at the host metrics.
Keeping twelve to fifteen percent reserved is a sensible baseline for most setups. These trade-offs are also visualized in the preset buttons which load common configurations for Kubernetes, VMware or Proxmox. You’ll see that each platform handles the same math in its own way. A Kubernetes node can handle more contention due to its orchestration policy across containers. However, a VDI pool must have strict fairness, or users will complain. The reference table on the page spells this out nicely so you can define where your environment falls then dive into the numbers.
Bottom line: Overcommit is about trust. Trust that nothing’s going to go all wrong at once. When the peaks come together, that trust dissolves rapidly. Use the tool to determine your safe ceiling; then watch actual ready times during busy periods. Add more cores if necessary, or back off if you see latencies creeping up. Better to be slightly undercommitted than always struggling with scheduler pressure.
Remember: You want a host that doesn’t feel slow, not merely one that accommodates the largest number of machines. You began by asking “how many VMs can I squeeze into this?”. The real question is, “how many can I run without any trouble?” Keep that in mind as you move the sliders until you find the sweet spot on the performance/density graph.