CPU Utilization Calculator
Estimate CPU busy percentage, peak-adjusted utilization, usable core headroom, and queueing risk from sampled busy time, cores, wait loss, and workload demand.
⚙Server Workload Presets
📊CPU Sample Inputs
CPU Capacity Results
🧮CPU Metric Grid
📘CPU Reference Tables
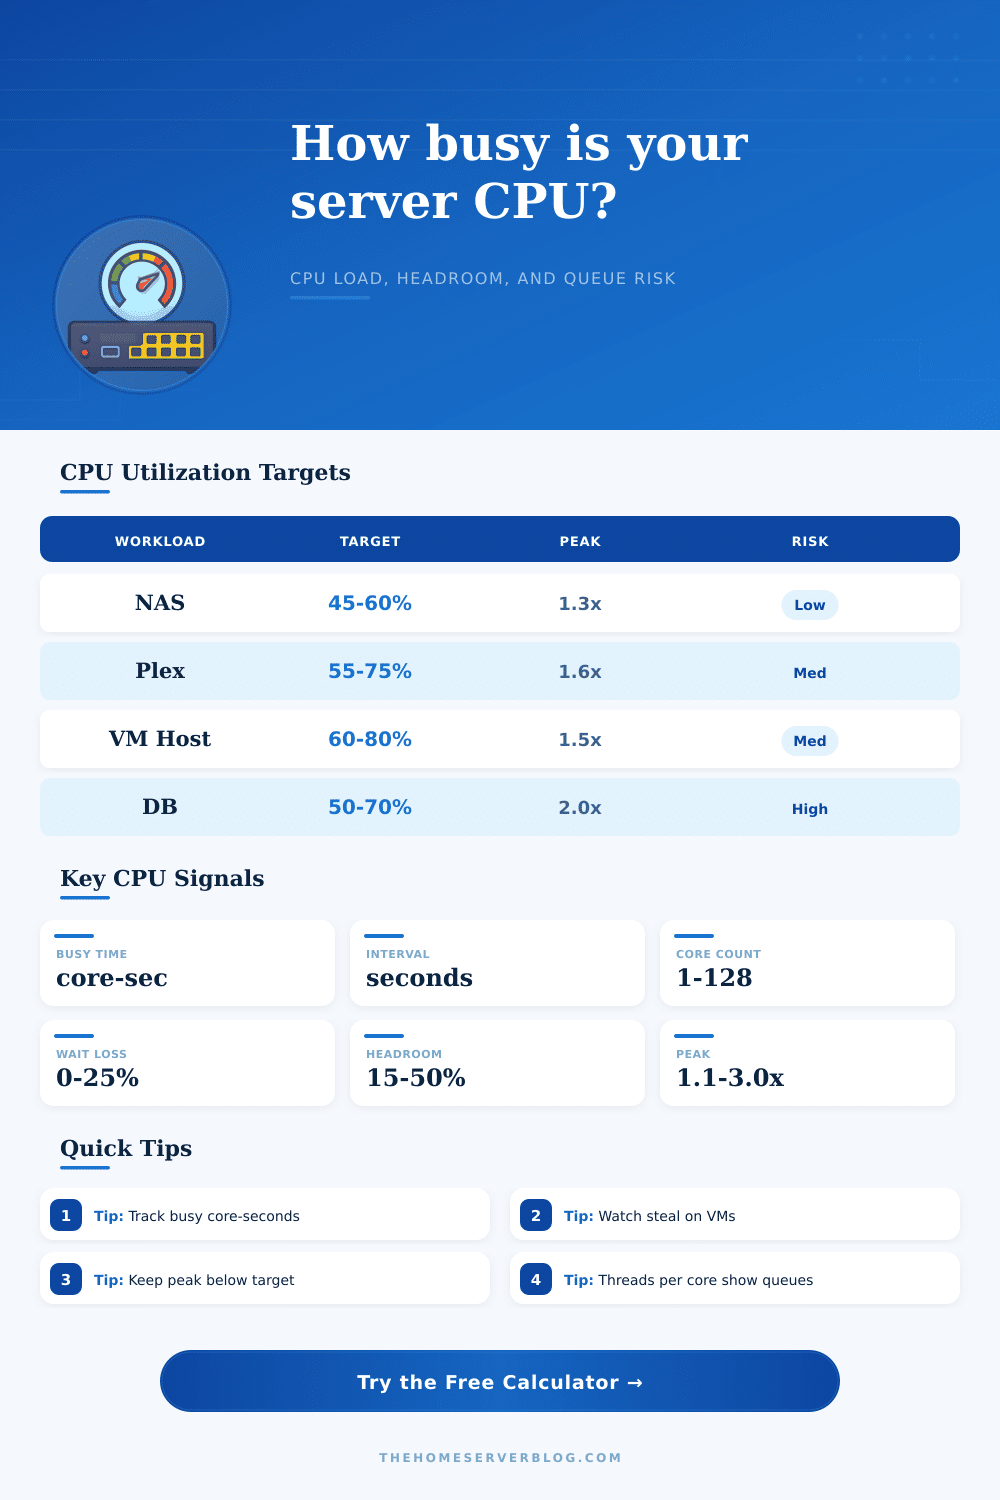
Workload utilization planning bands
| Workload | Typical Target | Peak Factor | Planning Note |
|---|---|---|---|
| NAS and file services | 45% to 60% | 1.2× to 1.5× | Storage waits often matter more than raw CPU. |
| Media transcode | 55% to 75% | 1.4× to 2.2× | Hardware encode can lower CPU busy time sharply. |
| VM or container host | 60% to 80% | 1.3× to 1.8× | Leave margin for noisy guests and migrations. |
| Database and search | 50% to 70% | 1.7× to 3.0× | High thread queues can increase latency quickly. |
| Firewall or router | 40% to 65% | 1.3× to 2.0× | Packet bursts need spare cycles for low jitter. |
Linux and hypervisor CPU metric guide
| Metric | Meaning | Good Range | Warning Signal |
|---|---|---|---|
| user plus system | Actual CPU work | Below target | Sustained above 85% |
| iowait | CPU waiting on I/O | 0% to 5% | Above 10% with slow jobs |
| steal | vCPU time taken by host | 0% to 2% | Above 5% on a VM |
| load average | Runnable plus waiting tasks | Near core count | Over cores for long periods |
| run queue | Tasks waiting for CPU | Below 1 per core | Above 1.5 per core |
Queueing risk bands
| Threads per Core | Risk Level | Latency Effect | Suggested Action |
|---|---|---|---|
| 0.00 to 0.75 | Low | Usually responsive | Keep current core count. |
| 0.76 to 1.00 | Moderate | Small waits possible | Watch peaks and iowait. |
| 1.01 to 1.50 | Elevated | Queues can form | Add headroom or tune jobs. |
| 1.51 to 2.00 | High | Latency climbs fast | Reduce concurrency or add cores. |
| Over 2.00 | Severe | CPU bound backlog | Scale out or reschedule batch work. |
Common server workload samples
| Scenario | Sample | Cores | Typical Watch Item |
|---|---|---|---|
| Idle NAS | 5 to 10 min | 2 to 4 | Scrub and backup spikes. |
| Plex transcode | 1 stream burst | 4 to 8 | Encoder path and thermal throttling. |
| Proxmox host | 15 min | 6 to 16 | Steal, ready time, and noisy VMs. |
| NVR recording | Camera peak | 4 to 12 | Motion detection and disk wait. |
| CI runner | Build job | 8 to 32 | Parallel jobs versus queue wait. |
💡CPU Planning Tips
A CPU utilization calculator are a tool that helps people to understands how much capacity a CPU has left. Many times, people will find that the server are slow before they find that the CPU is the issue. A CPU can become a bottleneck for a system if it is overloaded with tasks such as data backup or moving virtual machine.
A CPU utilization calculator can provide a clear picture of how much headroom a CPU has. Headroom refer to the amount of capacity that a CPU has left before it begins to form queue. The inputs for a CPU utilization calculator can help determine how much headroom a CPU has.
How to Use a CPU Utilization Calculator
Busy time is one of the inputs into the CPU utilization calculator. Busy time is the amount of work that the CPU’s cores performed during a specific time period. Another input is the sample interval, or the time period during which the calculations will be performed.
Core count is another input into the calculator; it is the total number of CPU core (physical or virtual). Thread load is another input; this reflects whether the work on the CPU is utilizing the core or if there are queues of work waiting to utilize the CPU. Steal time and iowait percentage are two additional inputs; the CPU reports that this time is CPU time; however, steal time and iowait time are not available to the workloads on the server.
Headroom can be the amount of CPU headroom that is left for spikes in CPU utilization. Another input is the peak factor; this is used to convert the average CPU measurements to the worst case measurements for CPU utilization. Finally, another input is risk tolerance; this is used to determine whether the system can take a spike in CPU utilization, or if the workloads are more latency sensitive than others.
There are a variety of different CPU measurements and parameters, and these parameter interact with each other. For instance, one may see that a given application’s CPU is at a moderate utilization, but it may be slow due to high steal time; the hypervisor are taking the CPU cycle to provide CPU time to another tenant of the server. In another example, a high amount of iowait time may indicate that a system is slow; however, the CPU core are actually idle but waiting on the disks to provide the storage data to the applications using it.
The CPU utilization calculator takes into account parameter like wait loss. The calculator also takes into account the peak factor to calculate the headroom. Finally, the CPU utilization calculator provides a number to the individual that is using the tool; it does not have to reference the separate graph of the various CPU measurements.
A CPU will not remain at a steady state; real machine will have fluctuations in the CPU’s utilization. For example, a network attached storage (NAS) device may have a low CPU utilization the majority of the day, but experience a high CPU utilization when the data backup process begins. A media server application may shift from low to high CPU utilization when user begin streaming media file of high bit rate.
The peak factor allow for CPU utilization to be calculated with these fluctuations in mind. A higher peak factor will calculate a headroom for the CPU as if it is experiencing a higher utilization than the sample data of CPU utilization gathered from the server. An individual’s understanding of thread load relative to the core count of the CPU may introduce error with the CPU utilization calculator.
For example, a load average value relative to the CPU’s core count may appear high, but a load average that is higher than the core count of the CPU indicate that work is awaiting access to the CPU core. A CPU utilization calculator is able to account for load average value through the use of risk tolerance. The risk tolerance for a given system will indicate the different level of CPU risk (low, medium, high, severe); this will help to determine whether the core count of the CPU is enough for the workloads on the server.
Thus, if the risk tolerance is set to a value that indicate sensitivity to CPU latency, the CPU utilization calculator will recognize the risk of a high CPU utilization earlier than a batch process server. A common error in understanding CPU utilization is to focus on the percentage of the CPU in use, but not to observe the remainder of the server. For example, CPU utilization does not take into account disk throughput or network saturation.
Therefore, the CPU utilization calculator does not account for these factor; its suggestion are relative only to the CPU. Therefore, if the CPU utilization calculator suggests an increase in the number of CPU core, but the system has known network or disk saturation issue, the individual has been reminded to inspect the disk or network instead of the CPU. Another error is to sample the CPU at quiet period to determine the CPU utilization of the system; however, this does not account for CPU utilization at busy period.
The preset value established by the CPU utilization calculator are created to calculate CPU utilization during busy period for the server. The goal of a CPU utilization calculator is not to keep the CPU at a 0 percent utilization. Some headroom is necessary for sudden spike in CPU utilization due to update or other task.
However, if too much headroom is provided, then the company is wasting money and resource with the CPU. The workload of the system and the level of queuing that is acceptable can determine the amount of headroom that is necessary for a given system. The CPU utilization calculator accounts for all of the parameter of a system so that an individual does not have to monitor the CPUs separately.
The number provided from a CPU utilization calculator will be most useful to an individual if they take some action based on the utilization. For instance, if the CPU has healthy margin for CPU utilization and risk of queuing, they can focus on other task of the system. However, if the CPU calculation indicate that there is a need for more CPU core, or if there is a risk of queuing, the individual has a reason and justification to act on that suggestion.
Therefore, the CPU utilization calculator provides an individual with a helpful tool to take action on the calculation provided.