CWDM Channel Planner Calculator
Plan CWDM wavelengths, channel span, fiber attenuation, mux insertion loss, connector loss, and usable optical margin before selecting color optics or passive filters.
CWDM channel plan results
| Wavelength | Band | Water peak note | Typical home lab use |
|---|---|---|---|
| 1270 nm | O band | Outside water peak | Short access rings, lab muxes, low-channel-count starts |
| 1290 nm | O band | Outside water peak | Pairs well with 1310 and 1330 nm in compact muxes |
| 1310 nm | O band | Standard SM reference | Common baseline for single-mode optics and test gear |
| 1330 nm | O band | Outside water peak | Often used in 4-channel access and DCI sets |
| 1350 nm | O band edge | Near E band edge | Use datasheet attenuation for older cable |
| 1370 nm | E band | Water peak risk | Prefer low water peak fiber or skip on legacy spans |
| 1390 nm | E band | Water peak center | High-risk channel on older high-OH fiber |
| 1410 nm | E band | Water peak shoulder | Usable on modern low water peak OS2 after checking margin |
| Wavelength | Band | Loss behavior | Typical home lab use |
|---|---|---|---|
| 1430 nm | E/S edge | Recovering from water peak | Use with caution on legacy fiber |
| 1450 nm | S band | Lower than E band on OS2 | Useful middle channel in 8-channel muxes |
| 1470 nm | S band | Good OS2 planning region | Common first channel for 4, 8, and 16 channel muxes |
| 1490 nm | S band | Good OS2 planning region | Often overlaps with access/PON test habits |
| 1510 nm | S/C edge | Low single-mode loss | Popular CWDM color for medium spans |
| 1530 nm | C band | Low single-mode loss | Good for longer links when optics are available |
| 1550 nm | C band | Very low OS2 loss | Longer home campus or metro-style spans |
| 1570 nm | L band edge | Very low OS2 loss | High-number CWDM mux channels |
| 1590 nm | L band | Low OS2 loss | Upper mux channels with strong reach |
| 1610 nm | L band | Bending sensitivity can rise | Check cable bends, filters, and optic spec |
| Mux size | Example wavelengths | Span | Planning note |
|---|---|---|---|
| 4 channel | 1470, 1490, 1510, 1530 nm | 60 nm | Simple home lab uplink bundle or separate LAN/storage/services colors. |
| 8 channel | 1470 through 1610 nm | 140 nm | Common passive CWDM set with good loss behavior on OS2. |
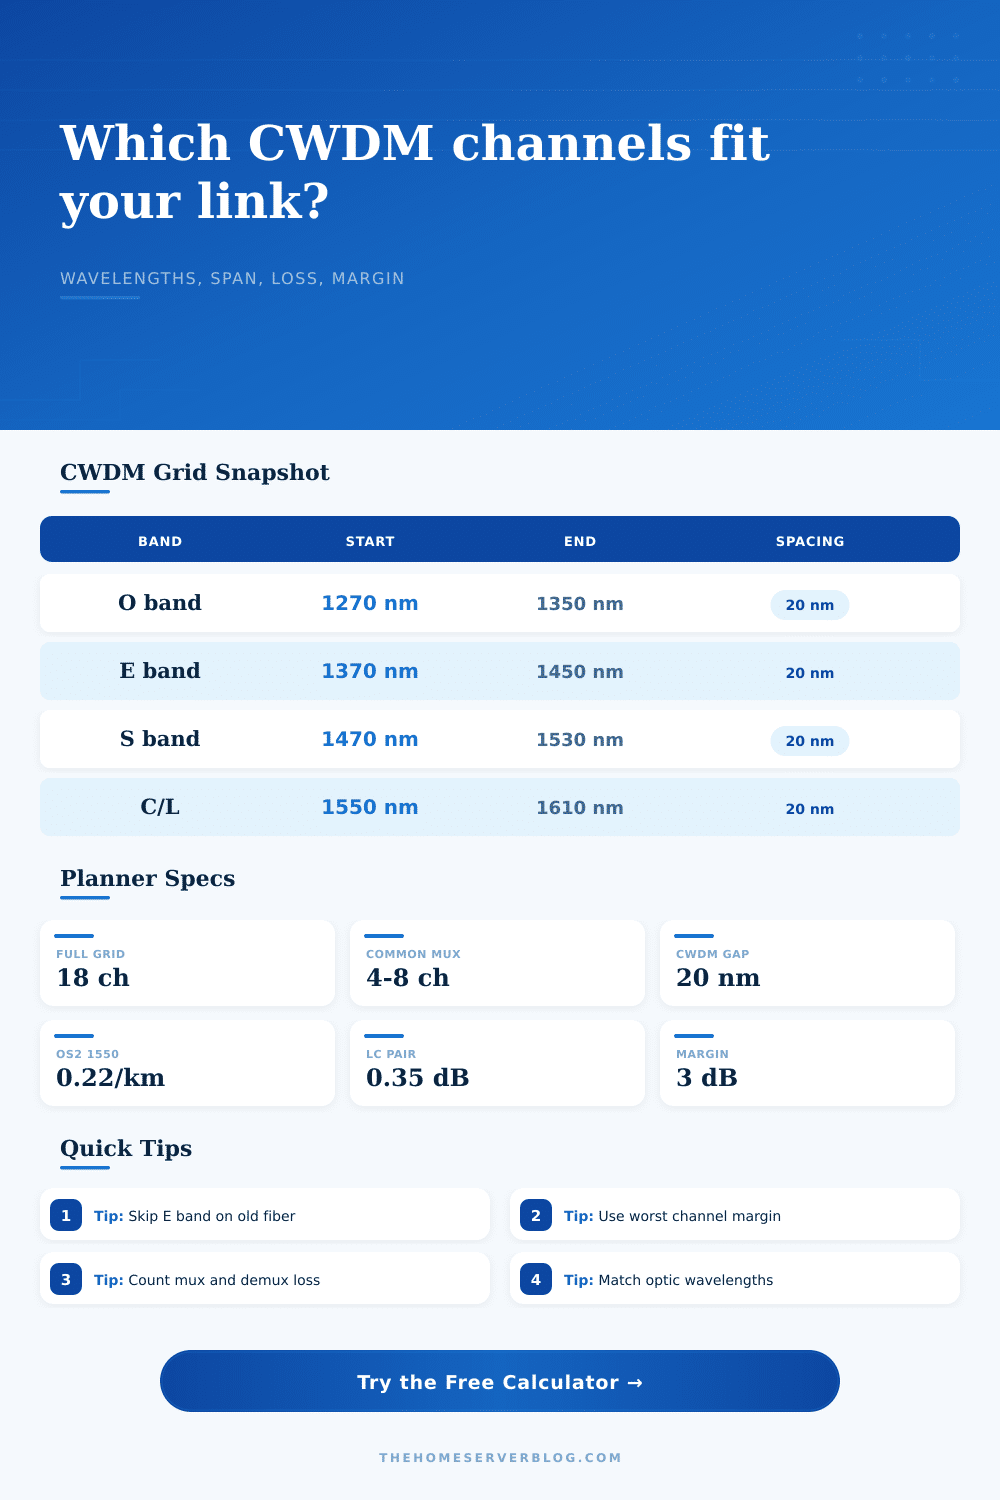
| 8 channel legacy | 1270 through 1450 nm, skip 1370/1390/1410 | 180 nm | Needs extra room because skipped E-band channels leave gaps. |
| 16 channel | 1270 through 1610 nm, skip 1370/1390 | 340 nm | Requires low-loss muxes, available optics, and careful margin check. |
| Fiber profile | O band | E band | C/L band |
|---|---|---|---|
| OS2 G.652.D low water peak | 0.34 to 0.36 dB/km | 0.31 to 0.38 dB/km | 0.22 to 0.26 dB/km |
| Legacy G.652 high water peak | 0.35 to 0.40 dB/km | 0.55 to 1.20 dB/km | 0.23 to 0.28 dB/km |
| G.655 NZDSF | 0.35 to 0.38 dB/km | 0.34 to 0.45 dB/km | 0.22 to 0.25 dB/km |
| G.657.A access | 0.35 to 0.38 dB/km | 0.34 to 0.42 dB/km | 0.23 to 0.28 dB/km |
| OM4 short CWDM lab fiber | 1.00 to 1.40 dB/km | Not typical | Not typical |
Coarse Wavelength Division Multiplexing is a way to take one fiber pair and create several connections from that one pair. In this system, different streams of data goes down in separate wavelengths (colors) of light simultaniously.
Glass fibers are stiff in their ways, though. If you don’t account for each wavelength weakening over time, it’ll let you down when you least expect it. There’s a planning tool to do math for you, but knowing why avoids an expensive misstep.
How to Plan a CWDM Link
Not all wavelengths will make it as far. They won’t. If you are using old fiber, there is a huge water absorption spike at 1383 nm from the hydroxyl ions in the fiber. This “water peak” can ruin your signal strength and turn a good channel into dead air. Low water peak fiber solve this problem but many locations still run old cable.
Before buying your optics, you must understand what kind of cable is being used. Choosing the fiber type allow the calculator to adjust loss coefficients for E band. It’s just one little step that can save hours of troubleshooting.
Don’t forget the “passive” hardware as well. Each time a beam of light goes through a mux or demux module there’s an insertion loss associated with it. In a typical plan there will be two of these devices in each direction, so the loss accumulate. There’s typically another penalty (about 0.35 dB per pair) for connectors. These are easy to overlook but are part of reality when installing hardware in field.
The tool applies those penalties in addition to using worst-case fiber attenuation. That’s critical; we need the link to function for the weakest channel, not the average one.
Failure mode: Budgeting is where most plans fall apart. You plug in how much power you transmit minus how sensitive your receivers are. This is called your transceiver power budget. If the sum of all your losses exceeds that number, then there isn’t enough light to read.
The planner takes away what you know about your losses, and sets aside some margin. It is best to leave yourself with a few decibels of headroom. That’s for dirty connectors, components that age, and changes you may make later on. If not, it works until one day it doesn’t.
Density vs. Reach, Selecting the appropriate bands to carry traffic is a balancing act between density and reach. The C and L bands typically has less attenuation on standard single mode fiber, making them safe for long runs. The O and E bands typically have more attenuation and are not safe for long runs.
However, the O and E bands has less loss on certain fibers while having higher losses on others. If you’re not sure about your fiber quality, you may want to avoid the E band all together. Sacrifing channel count for reliable performance seems like a reasonable decision.
The simplicity of CWDM lies in the use of wide 20 nm channel spacing. That means inexpensive passive filters and uncooled lasers. This makes it cheaper then dense wavelength division multiplexing (DWDM). Unless you really need DWDM, it’s overkill for a small business or home lab. On the other hand, CWDM offers an optimal balance of cost vs performance.
The color picker provide an illustration of the grid and indicates which colors is possible within your budget. Building a wavelength division multiplexed link is all about managing expectations. Physics imposes limits on how far light will go. That’s where the tool come in. It gives you a realistic preview of these limitations.
Put in the fiber type, span length and number of connectors and it shows you clearly what works and what doesn’t. It turns engineering from guesswork. A healthy margin accounts for things like dirty connectors and aging components so the link can survive daily use.
Keep your margin healthy, respect the water peak and start with the worst channel. How you build a link that lasts?