Optical Return Loss Calculator
Estimate total fiber ORL from connector reflectance, connector count, splice reflectance, splitters, launch power, measured reflected power, APC/UPC mix, fiber length, wavelength, and a target threshold.
1Optical plant presets
2Fiber ORL inputs
Optical return loss result
Breakdown
Reflection contribution
3Live ORL quick cards
4Connector polish comparison grid
5ORL, reflectance, and reflected power tables
ORL pass/fail bands for optical plant work
| Effective ORL | Reflected power ratio | Typical reading | Planning note |
|---|---|---|---|
| 45 dB+ | 0.0032% or less | Excellent APC plant | Strong for analog overlay, PON, and sensitive bidirectional optics. |
| 35 to 45 dB | 0.0032% to 0.032% | Good optical plant | Common target zone for clean APC outside plant and campus fiber. |
| 26 to 35 dB | 0.032% to 0.25% | Usable, verify | Often acceptable for short UPC data links; review PON and analog paths. |
| under 26 dB | More than 0.25% | Investigate | Clean, inspect, isolate connectors, and retest with a launch cord. |
Reflectance references by optical event
| Event | Typical reflectance | Best use in calculator | Notes |
|---|---|---|---|
| APC mated pair | -55 to -65 dB | Connector reflectance | Preferred for PON, RFoG, and analog optical services. |
| UPC mated pair | -45 to -55 dB | Connector reflectance | Common in Ethernet optics, transceiver jumpers, and short lab links. |
| Fusion splice | -60 to -75 dB | Splice reflectance | Low reflection when properly fused and protected. |
| Mechanical splice | -35 to -50 dB | Splice reflectance | Use conservative values when gel age or alignment is unknown. |
| Splitter module | -50 to -60 dB | Splitter reflectance | Reflections behind the split also receive two-way splitter loss. |
Splitter loss and ORL sensitivity
| Splitter | Nominal loss | Reflection impact | Where ORL matters |
|---|---|---|---|
| 1x2 | 3.5 dB | Moderate | Small tap networks, monitoring branches, and redundant test paths. |
| 1x8 | 10.5 dB | Lower far-end echo | Small PON cabinets and building distribution panels. |
| 1x32 | 17.0 dB | Far reflections muted | Common FTTH split where near connectors still dominate ORL. |
| 1x64 | 20.5 dB | Very low far echo | High-split PON design with tight total loss and ORL checks. |
Wavelength assumptions used by the calculator
| Wavelength | Default attenuation | Backscatter basis | Practical context |
|---|---|---|---|
| 850 nm | 3.00 dB/km | -72 dB/km | Short multimode links, VCSEL optics, and data center patching. |
| 1310 nm | 0.35 dB/km | -79 dB/km | Single-mode OTDR, campus, and many bidirectional optics. |
| 1490 nm | 0.25 dB/km | -81 dB/km | GPON and XGS-PON downstream planning checks. |
| 1550 nm | 0.22 dB/km | -82 dB/km | CATV overlay, long spans, and low-loss single-mode paths. |
| 1625 nm | 0.24 dB/km | -84 dB/km | Maintenance testing and live-fiber monitoring bands. |
6Practical ORL tips
Fiber optics are light sensitive. If any light bounce back into the fiber from somewhere else, that light will disturb your connection. This reflected light is known as optical return loss. Even though it might look good on the other end, it will result in link drop-outs and bit errors. Standard power meters don’t see this problem. The issue is not always obvious on a standard power meter.
Using the calculator above, you can enter exactly what is in your fiber optic network. You can include the number of splitters and splices, as well as types of connectors and their polish. It will give you an estimate of your total optical return loss. That’s a concrete number you can work with; until then, it’s a fuzzy worry.
How to Fix Fiber Optic Reflection Problems
This is where your connector type comes into play, typically most critically. UPC (blue) connectors is flat while APC (angled/green) have an angled end face that reflects much less light than the UPC end face does. An APC end face tends to send reflected light back into the cladding where it dissapears; the UPC end face simply sends it right back down the core. In practical terms, this has a big performance margin: you’ll want angled connectors for passive optical networks. The tool allows you to mix connector types. You can probably get away with a mixed-link of all APC connectors passing strict tests, whereas the same test may fail if you use a UPC patch cord or two.
Return loss is also impacted by splices and splitters, but typically not as strongly than connectors do. Properly executed fusion splices has almost no reflectance, essentially vanishing from the equation. Mechanical splices depend on physical alignment and gel that may deteriorate with age. The calculator provides a way to increase the reflectance number to account for this risk.
The calculators make splitters tricky because light must travel into the splitter to get out to the end-user and then back again through it. That double loss reduces signal reflected off the distant end, making the resulting return loss values better.
One other thing: fiber length does matter, but not always as you’d think. Because longer spans reduce the amount of light that gets reflected back into the source, they may appear to have lower return loss. A long cable could actualy have better return loss numbers than a short cable because any reflected signal weakens over time and never makes it back to the far end. That’s why a short link will appear bad if the connectors are dirty and a long link with equally dirty connectors will appear OK because the signal isn’t strong enough for you to detect it. The calculator breaks this down so you can understand how clean your connections are independently of how long your links are.
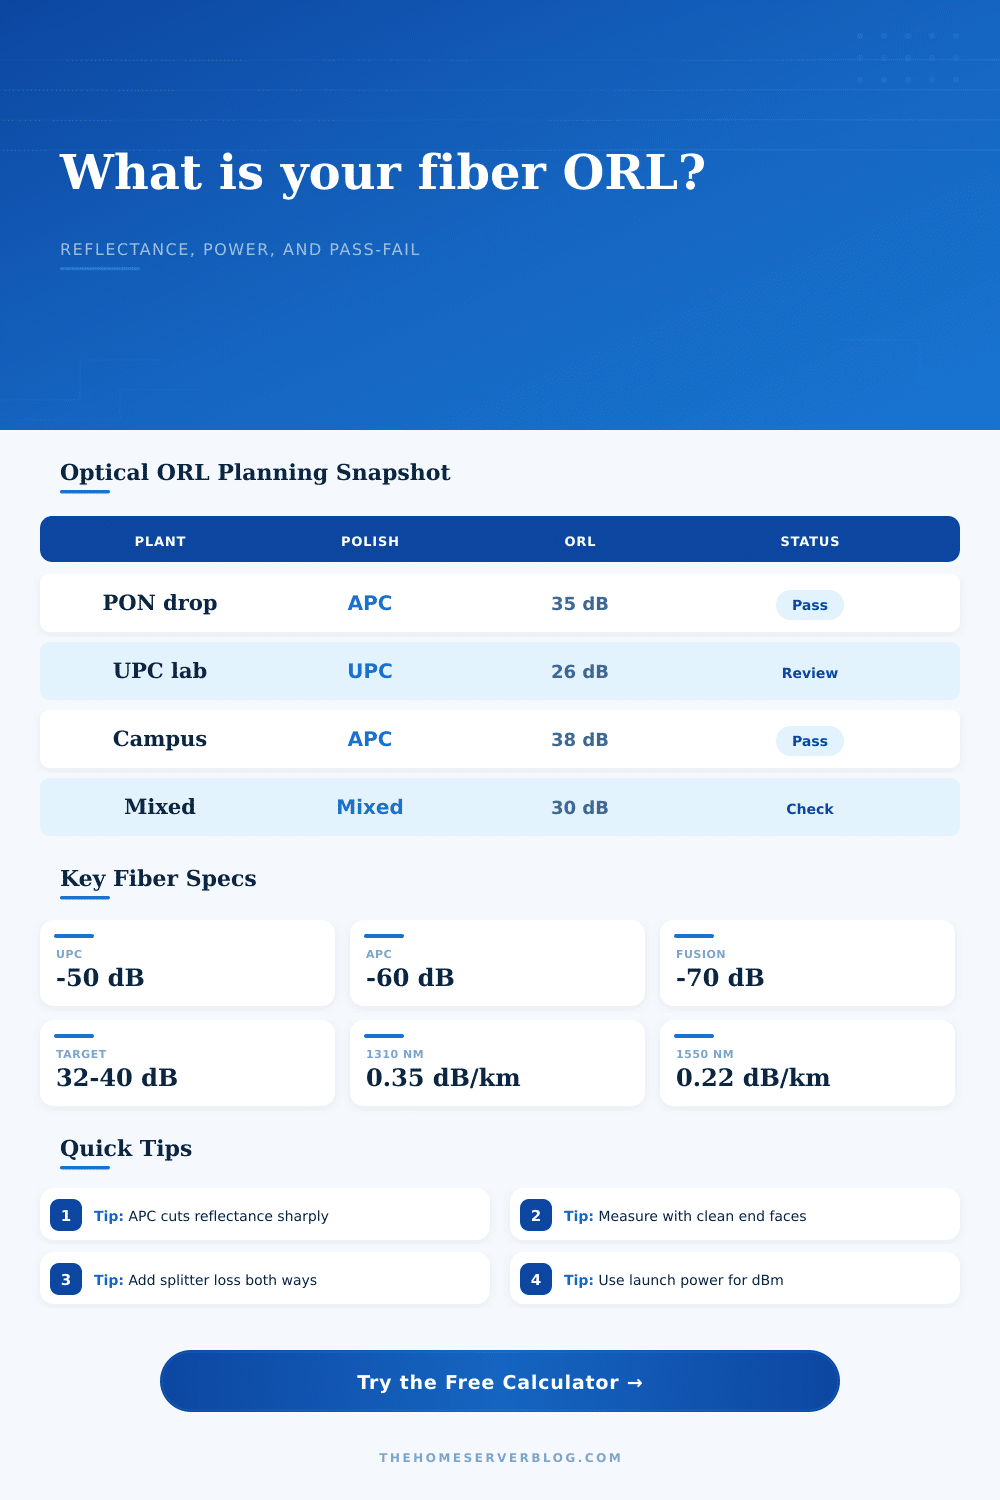
Then there’s the actual result. It shows whether it passed or failed your target and gives you an effective return loss in decibel form. If you’re dealing with high-speed PON systems or other overlay analog video, you’ll be shooting for results north of thirty-two decibels. With standard Ethernet data, you have some wiggle room but definitely don’t want to venture into the danger zone. That banding is explained well on the page in a table that displays which ranges represent excellent, good, or problematic performance.
The biggest improvement you can make is to clean your connectors. Cleaning your connectors is the single most effective thing you can do to reduce return loss issues. Return loss failures have more to do with oil or dust on the ferrule face than any poor connector design. So check and clean it every time you mate one up. Yes, I know…. It’s tedious work, but you save countless hours troubleshooting and this calculator will help you plan for the run while keeping things running cleanly.
When you realize that reflections can be measured and you manage the light path to match, you quit guessing. You start doing what needs to be done to keep the light out in the fiber and prevent it from coming back to mess with the transmitter.