dBm to Milliwatt Table Calculator
Convert RF power from dBm to milliwatts and watts, generate a custom step table, add antenna gain and cable loss, then check EIRP headroom and receiver margin.
| dBm | mW | W | EIRP dBm | Limit headroom | Estimated RSSI | Link margin |
|---|---|---|---|---|---|---|
| 5 dBm | 3.16 | 0.0032 | 7 dBm | 29 dB | -89 dBm | -7 dB |
| dBm | mW | W | Power ratio from 0 dBm |
|---|---|---|---|
| -30 dBm | 0.001 mW | 0.000001 W | 1/1000 of 1 mW |
| -20 dBm | 0.01 mW | 0.00001 W | 1/100 of 1 mW |
| -10 dBm | 0.1 mW | 0.0001 W | 1/10 of 1 mW |
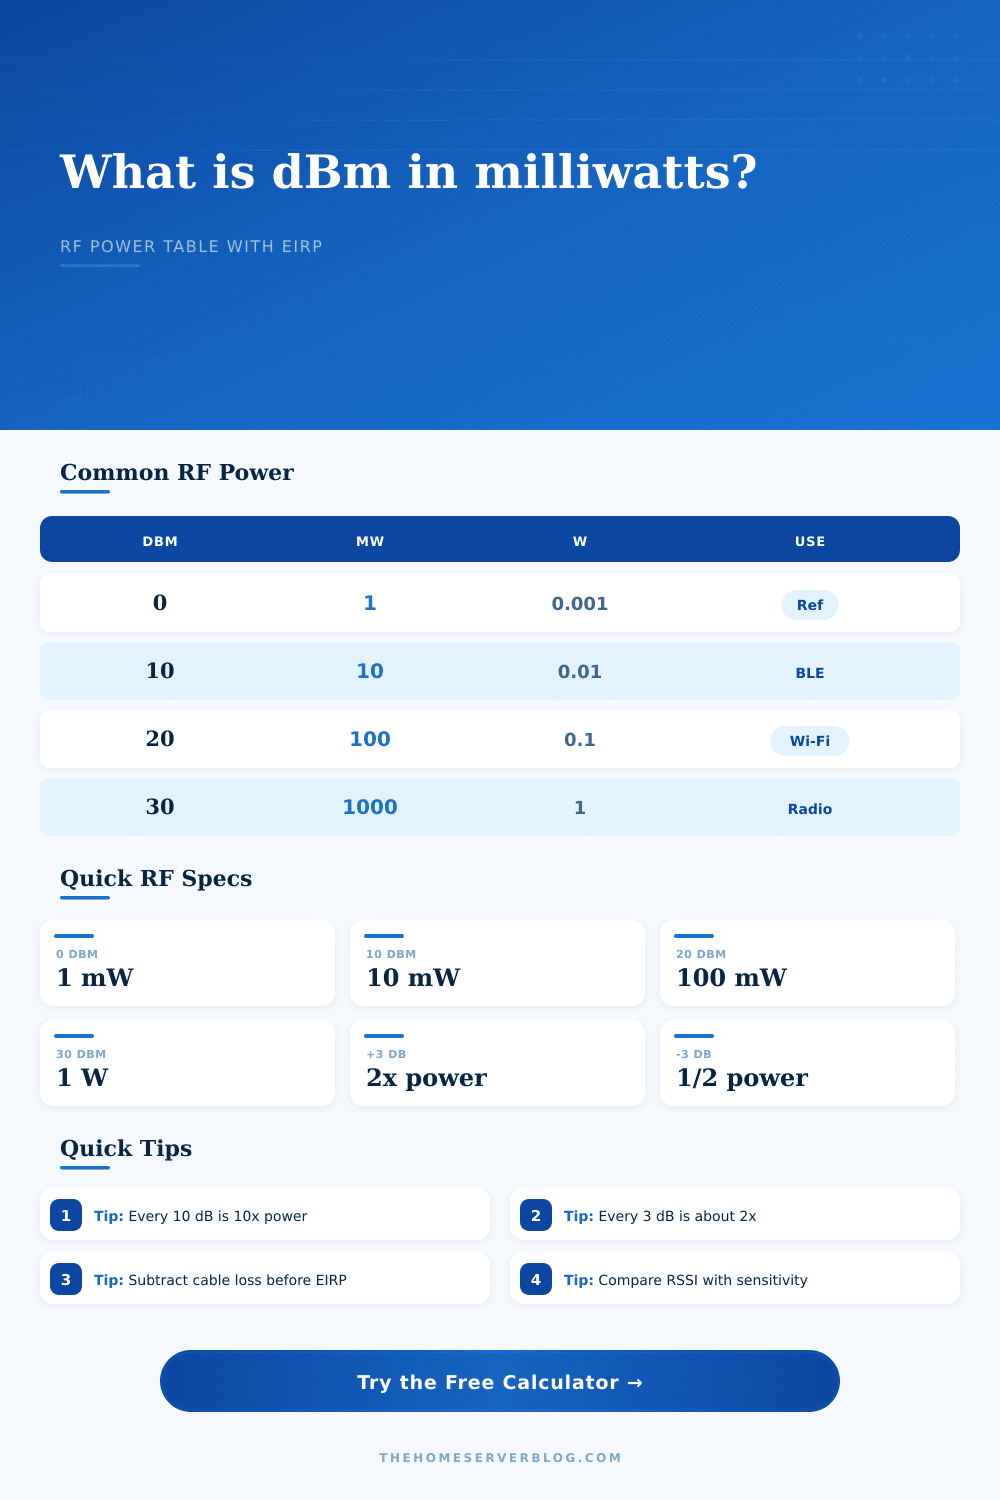
| 0 dBm | 1 mW | 0.001 W | reference |
| 10 dBm | 10 mW | 0.01 W | 10x |
| 20 dBm | 100 mW | 0.1 W | 100x |
| 30 dBm | 1000 mW | 1 W | 1000x |
| 40 dBm | 10000 mW | 10 W | 10000x |
| Change | Power ratio | Example from 20 dBm | RF meaning |
|---|---|---|---|
| -10 dB | 0.1x | 10 mW | one tenth of the power |
| -6 dB | 0.25x | 25.12 mW | about quarter power |
| -3 dB | 0.5x | 50.12 mW | about half power |
| +3 dB | 2x | 199.53 mW | about double power |
| +6 dB | 4x | 398.11 mW | about four times power |
| +10 dB | 10x | 1000 mW | one watt from 20 dBm |
| Link margin | SNR clue | Typical result | Use case |
|---|---|---|---|
| < 0 dB | below threshold | unreliable or no link | debug only |
| 0-9 dB | thin margin | low rate or dropouts | temporary links |
| 10-19 dB | usable margin | stable basic service | home lab clients |
| 20-29 dB | strong margin | good rate headroom | mesh and bridges |
| 30+ dB | excellent margin | robust link budget | fixed RF paths |
| Scenario | Common level | Equivalent power | Calculator note |
|---|---|---|---|
| Low-power sensor | 0 to 8 dBm | 1 to 6.31 mW | short range, battery friendly |
| LoRa end device | 14 to 22 dBm | 25 to 158 mW | often region and duty-cycle limited |
| Wi-Fi client | 12 to 18 dBm | 16 to 63 mW | client often weaker than AP |
| Wi-Fi AP radio | 17 to 23 dBm | 50 to 200 mW | add antenna gain for EIRP |
| Point-to-point radio | 23 to 30 dBm | 200 mW to 1 W | directional gain dominates EIRP |
Quiet 20 MHz channel estimate for sensitivity checks.
Common planning target for stronger roaming clients.
1 mW reference output for close-area devices.
6.31 mW class output for smart home mesh nodes.
25.12 mW class endpoint before antenna gain.
100 mW conducted power before antenna and loss.
Common shorthand for one watt RF output.
High EIRP comparison point for some Wi-Fi limits.
A dB is a unit of ratio. It is not absolute power or measure of anything else. It is just a unit for comparing strength of one signal against another, or how loud a sound is compared to another sound.
If you add an ‘m’ at the end (dBm), then you’re anchoring this ratio to a known baseline; a milliwatt of power. Adding that tiny letter shifts from a comparison to a concrete measurement of energy. It’s the distinction between saying something is twice as bright versus saying how many lumens a bulb gives off.
How Decibels and Signal Strength Work
A dBm is hard for most folks because numbers are arbitrary until you get the scale. Once you know what’s going on with your devices, plugging their specs into the calculator above takes care of the math for you, no need to puzzle through conversions and coefficients.
It’s unintuitive, but also pretty simple at its core: decibel measurements use logs (hence the name), so that ten dB always increases or decreases power by a factor of ten. So if you have 10mW (milliwatts) and add ten dB, you get ten times as much. Subtract ten and you gets a tenth of your original. That log property lets you string gains and losses together simply by adding and subtracting decibels. Adding cable loss and antenna gain doesn’t require a complicated spreadsheet; just add the dBs.
Understanding what’s being measured at each point is realy the trick here. Where most newbies stumble is figuring out their antenna gain. Higher rated antennas seem like they have more power. They don’t. That’s just focusing the power in one direction. When you remove the cap from your shower head, the water doesn’t flow harder, only tighter and farther.
You enter your antenna gain into the calculator and see what effect of that is on the EIRP. That’s the effective power that comes out of the antenna. That’s what regulators are concerned with. Too much and you might be interfering with something else or your neighbor. It’s spelled out nicely in the reference table on the page for the usual suspects.
The other thing with all RF links is that there’s a quiet thief: cable loss. A coaxial cable weakens the signal. The longer the run or the smaller the cable diameter, the greater the loss. Your transmitter may be super-strong, but if you’re feeding it into fifty-foot of bargain-basement cable, then most of that power will dissipate as heat before it ever makes it up to the antenna.
That’s why the calculator has a separate place for entering cable loss. It subtracts the cable loss from the transmitter power, then adds the antenna gain. If you don’t account for it, your link budget will be wildly optimistic. You’ll think you’ve got a strong signal, but what the receiver sees is nothing but noise.
The other side of this is receiver sensitivity. This is how weak of a signal a radio can decode correctly. Wireless standards today are amazingly sensitive. They can extract information from a signal 1000x weaker than the noise floor.
The catch: there isn’t one number for sensitivity. It varies with the data rate. To get faster data, you need a higher signal. But if you’re okay with slower speeds, then the radio can listen for whispers that are barely detectable. That’s the key tradeoff in designing networks.
The Link Margin represents how far your receive signal falls below the sensitivity threshold. It’s a measure of whether link is good (positive) or bad (negative). The bigger the margin, the stronger the link is even in bad weather or interference. That margin gets calculated by taking your EIRP minus path loss.
In other words, if the margin is thin, your link will drop out as you move your antenna just a bit off-course due to the wind. Thick margin means you could of some room to play with and handle changes to surroundings or expand later.
The lab tests aren’t the same as what happens in the real world. The signal gets absorbed by walls, blocked by trees, even absorbed by human bodies walking through area in front of the antenna. Those are difficult things to accurately measure.
This is why there is a “path loss estimate” field in the calculator. Input your best guess there, how far away is it? What is it going between? Be conservative. Users who overestimate performance will be frustrated. Users who underestimate performance simply purchase an antenna that’s slightly more capable than required.
It takes a bit of getting used to that change is from linear watts to log DBM but that’s why engineers use it. It makes the algebraic system work out for really complicated systems. By adding and subtracting the dB values of components you can string dozens together. It reduces multiplication to addition.
And once you get that rhythm, the numbers begin to make sense. That’s where the milliwatt comes in. It’s just an anchor point that keeps all this math tethered to something real: amount of actual power on the wire. That’s what’s important too, not just the ratio. It bridges the gap between math and real world equipment on your desk.