HomeServerBlog fabric traffic planner
East West Traffic Ratio Calculator
Estimate how much server-to-server traffic a home lab, private cloud, storage cluster, or microservice stack generates compared with north-south uplink traffic, then check fabric load, oversubscription pressure, and uplink headroom.
1Workload presets
2Traffic inputs
Traffic breakdown
Capacity check
3Live component summary
User, WAN, VPN, router, or firewall-facing traffic.
Application, cache, database, and file traffic between servers.
Replication and backup-window traffic inside the fabric.
Live migration and planned movement during the sample.
4Traffic pattern tables
| Pattern | Typical ratio | Dominant source | Fabric note |
|---|---|---|---|
| Simple web or reverse proxy | 0.5:1 to 2:1 | App to database, cache, and file shares | Uplink aware Router and firewall capacity still matter. |
| Virtualization cluster | 1:1 to 4:1 | Shared storage, backups, migrations, monitoring | Bursty Maintenance windows can dominate short samples. |
| Distributed storage | 3:1 to 10:1 | Replication, rebalancing, healing, scrubbing | Fabric heavy Keep non-blocking paths for rebuild events. |
| Microservice mesh | 4:1 to 15:1 | Internal API fan-out and telemetry | Chatty Watch small packet rate as well as Mbps. |
| Traffic class | Calculator input | Formula role | Planning cue |
|---|---|---|---|
| North-south | Mbps/server | Server count x external Mbps | Use firewall or router graphs during the busy hour. |
| Base east-west | Mbps/server | Server count x internal Mbps | Pull from switch flow data, hypervisor stats, or host exporters. |
| Replication | Mbps/server and factor | Replication Mbps x extra copies | Separate synchronous write traffic from async background sync. |
| Backup burst | GB/day and window | Changed GB converted to Mbps over backup hours | Short windows can exceed steady application traffic. |
| Fabric design | Oversubscription | Good fit | Watch point |
|---|---|---|---|
| Non-blocking lab core | 1:1 | Storage, HA migrations, lab testing | Transceivers and switch buffers may become the limit. |
| Balanced home rack | 2:1 | NAS, apps, light VM motion | Keep peak fabric pressure below about 70%. |
| Compact access layer | 3:1 to 4:1 | Mostly web, DNS, auth, small services | Backups and rebalancing should be scheduled carefully. |
| Constrained edge switch | 6:1+ | Low-power edge nodes or test benches | East-west bursts can look fine on average but queue at peak. |
| Sampling interval | Best for | Risk if too long | Risk if too short |
|---|---|---|---|
| 1 minute | Migration bursts and storage spikes | None for burst visibility | Noisy charts need smoothing. |
| 5 minutes | Most switch and firewall dashboards | Very short spikes get averaged down | Generally stable for planning. |
| 15 minutes | Backup windows and busy-hour trends | Microbursts disappear | Cleaner capacity conversations. |
| 60 minutes | Daily trend comparison | Peaks are hidden | Not enough detail for fabric sizing. |
5Workload comparison grid
6Planning tips
Data moves laterally (east-west) within your own rack, between your server. This is where lateral data movement can bottleneck. The quickest path to building a bottleneck are to ignore it.
Building out that home server cluster feel like a win … until you run a backup and find the network chokes. Your migration window drags on more longer than expected. A database sync slows down Plex streaming. Most times it’s not because your internet connection isn’t fast enough, it’s because there’s too much traffic moving sideways in your rack.
Why Your Home Server Network Gets Slow
Your network is designed with assumption that traffic flows north and south. For most of us, that was true two decades ago; we had server serving up static pages to remote clients. Not so much anymore. Your servers are talking to one another all the time in a moddern homelab. Maybe a virtual machine hits the cache, then the database, then the file share. This happen before sending a single byte back to your browser.
Without considering this internal chatter, your uplink capacity is a distraction. You may have a gigabit pipe to the router but your switch fabric could be saturated, leading to lag.
Once you enter your traffic and server estimates, the calculator do the math for you. No need to mess around trying to figure out conversions and coefficients. But that’s not what matters; what matters is knowing what goes into it.
Check out the replication factor parameter. Does it replicate a set amount of times? Do you have multiple mirrored node on a distributed storage like TrueNAS or Ceph? Every time you do a write op, it’ll cause additional network traffic. What does one megabit of actual data turn into when multiple copies is being synced? Three or four megabits moving around the fabric. That’s just from keeping copies up-to-date. People will measure how much payload moves about but miss measuring mechanical work of the copy.
Another issue is backup windows. Every night, terabytes of data may be backed up. That cause instantaneous bandwidth demand to spike in a narrow four-hour window. Even if the average daily transfer is modest, it’s the spike at peak that counts. Will your switches drop packets? Model that peak as a separate thing different than your steady-state application traffic. Isolate the migration events and the backup changes. Let the tool show you how those events crowd out the switch at certain times.
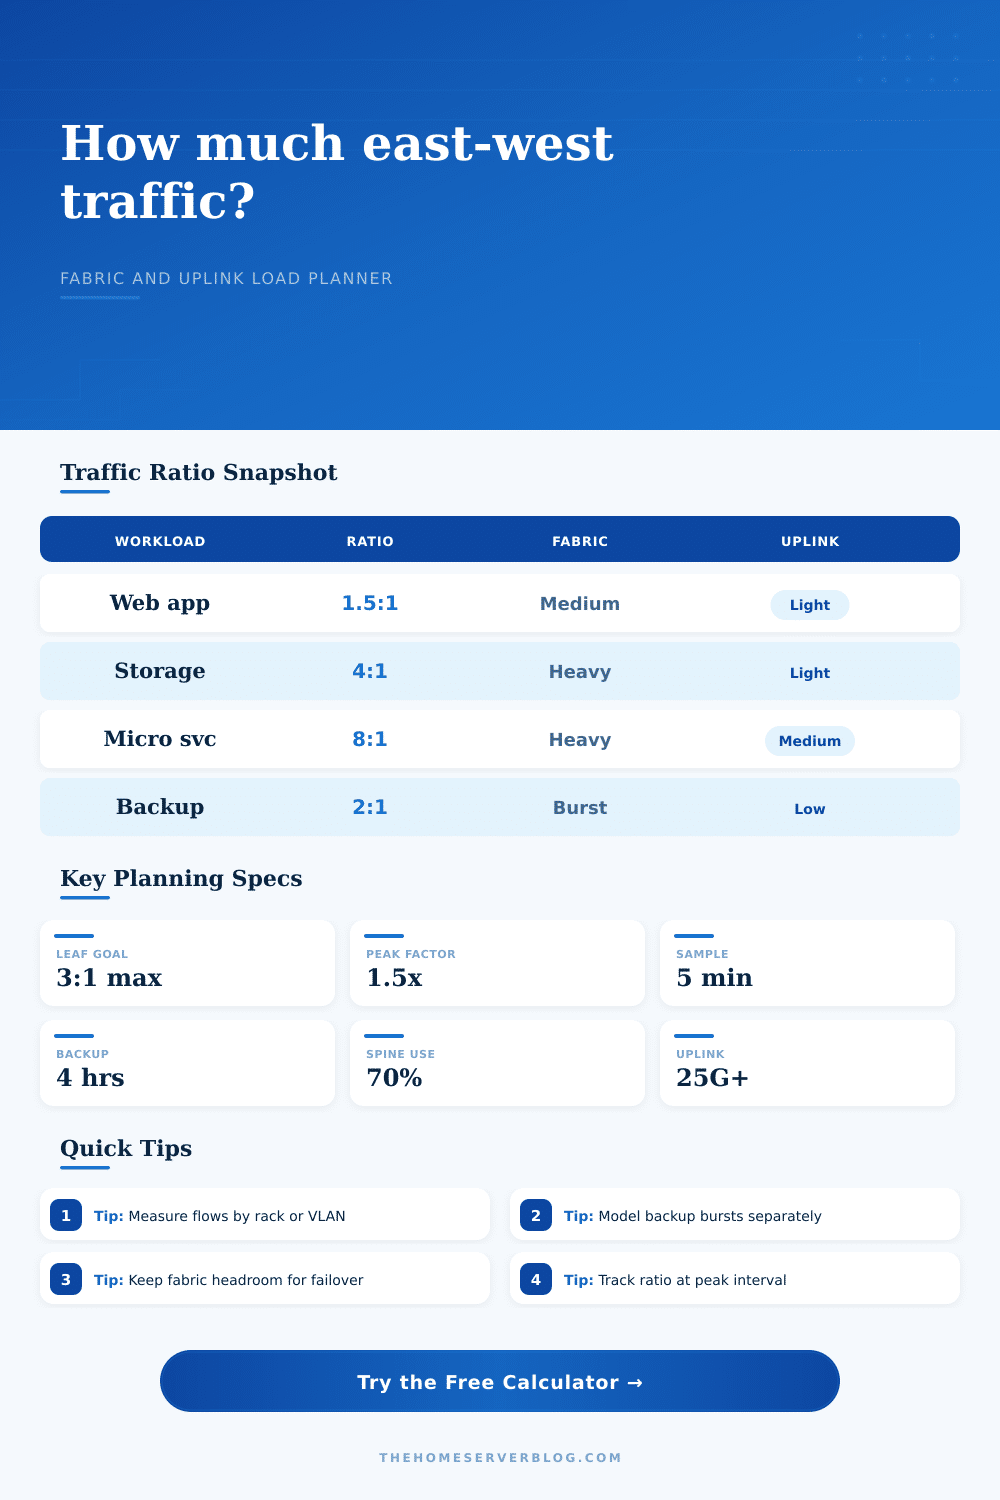
It’s made worse by container stacks and microservices. There are a dozen internal API calls being triggered for each user request across different services. That fan-out effect increases the east-west ratio a lot. In a typical web app, it will be one to two. That is, there are only twice as many internal requests than there are external requests. With a microservice mesh, you’re looking at eight to one easily.
At that point, your spine switches and top-of-rack leaf switches becomes the critical path. Your traffic never even leaves the local network so the uplink to the internet is irrelevant.
That leaves us with the last variable: oversubscription. Your typical commercial data center has one-to-one uplink bandwidth per port on a server. Your home lab probably has more oversubscription because you’re purchasing cheaper equipment. Two-to-one? Six-to-one? Great, so that’s how many servers is sharing a smaller pipe to the core. Busy hour traffic will encounter congestion if you have lots of oversubscription and a high east-west ratio. Pure math.
Now run that scenario and check the fabric pressure output. Did it exceed seventy percent? In this case, you have very little breathing room. A slight increase in user requests, a failover event, or a storage rebalance will pushes you into failure.
You don’t just want to move the data; you want to move it without queueing. You should of scheduled heavy replication tasks for off-peak hours so as not to bog down the fabric. Or upgrade your core switches to give them more capacity.
And this all comes down to network design: predicting chaos. You don’t know what’s going to happen when a virtual machine migrates itself at a bad moment. You don’t know which backup jobs is going to run long. All you do know is how much load you’re going to get. Build your fabric with headroom for that sideways traffic and the north-south bottlenecks stops mattering. Your servers will talk to each other freely. The rest of the house gets the bandwidth it expects.