Kafka, Pulsar, Kinesis, NATS, queues
Event Throughput Calculator
Estimate event production rate, compressed broker traffic, consumer capacity, lag risk, and partition count for event-driven systems before traffic peaks make the math less friendly.
Throughput breakdown
Event rate
Steady events/sec = producers x events/sec/producer. Peak events/sec = steady events/sec x burst multiplier.
MB per second
Raw MB/sec = peak events/sec x average KB / 1024. Compressed MB/sec applies the compression reduction.
Consumer capacity
Per consumer capacity = 1000 / processing ms/event, adjusted for batch efficiency and ack overhead.
Partition need
Partitions needed = peak events/sec divided by target events/sec per partition, rounded up to whole partitions.
Target utilization
Batch efficiency
Ack overhead
Consumer ceiling
| Workload | Typical event size | Traffic shape | Sizing concern |
|---|---|---|---|
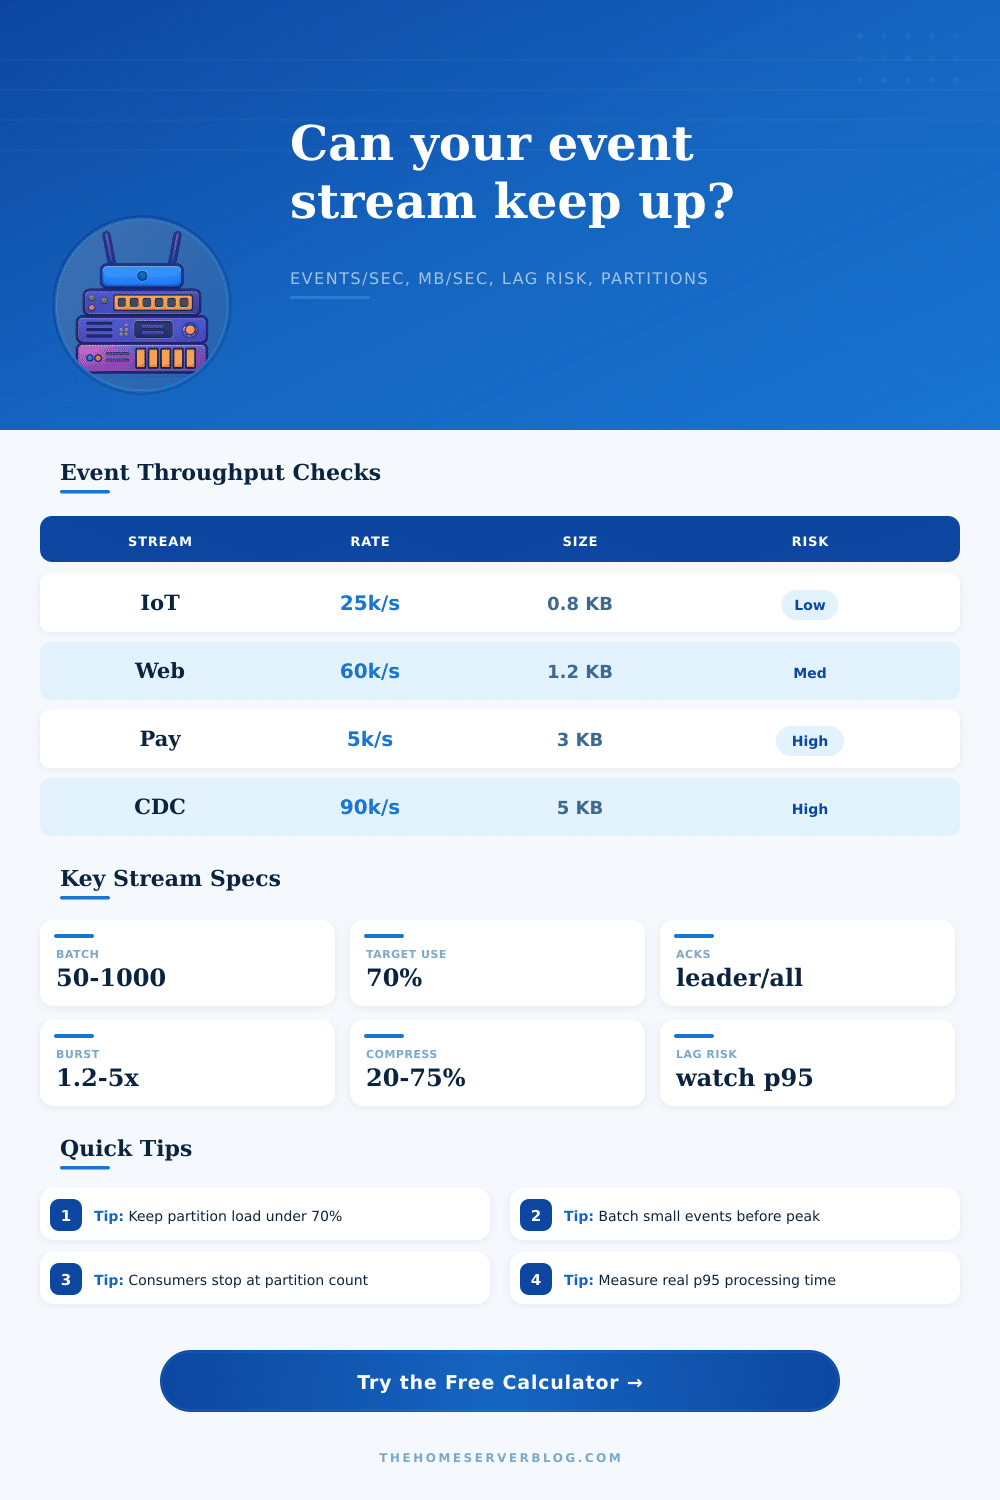
| IoT telemetry | 0.2-2 KB | Many small producers | Hot device fleets and burst fan-in |
| Web analytics | 0.8-3 KB | Sharp daily peaks | Batching and compression ratio |
| Payments | 2-8 KB | Lower rate, high durability | All-replica ack and retry behavior |
| CDC feeds | 1-20 KB | Write spikes from databases | Large records and sink latency |
| Ack mode | Calculator factor | Where it fits | Tradeoff |
|---|---|---|---|
| Fire and forget | Fastest partition estimate | Metrics, ephemeral telemetry | Potential loss on broker failure |
| Leader ack | Moderate overhead | General application events | Good speed with broker confirmation |
| All replicas | Heavier overhead | Audit, payments, CDC | Better durability, lower raw throughput |
| Transactional exactly-once | Highest overhead | Financial and dedupe-sensitive flows | Lower throughput and more coordination |
| Partition load | Interpretation | Action | Watch metric |
|---|---|---|---|
| Below 50% | Comfortable | Keep current topology | p95 publish latency |
| 50-70% | Healthy planning range | Validate peak tests | Broker CPU and disk queue |
| 70-90% | Tight during bursts | Add partitions or reduce event size | Request queue time |
| Above 90% | High risk | Shard earlier and remove hot keys | Produce throttling and lag growth |
| Consumer pattern | Good fit | Limit | Practical note |
|---|---|---|---|
| One consumer group | Parallel ordered processing | Cannot exceed partitions | Balance partitions before adding workers |
| Multiple groups | Independent downstream services | Repeats broker reads | Each group needs its own lag budget |
| Batch sink | Warehouse and lake writes | Flush interval adds latency | Batch by size and time, not size only |
| Retry topic | Poison event isolation | Can amplify traffic | Include retry multiplier in peak tests |
The reason most architecture decisions fail with streams is that estimates for capacity are optimistic. You tend to build your event pipeline assuming average traffic volume. Perhaps you includes a little extra buffer in case of spikes during high-traffic times. Then, suddenly, you roll out a marketing campaign. Or the entire fleet of device reboots itself all at once. Your consumers start falling behind. First it’s slow, then it gets worse faster. That’s capacity planning pretending to be performance.
The calculator do all this math for you. It converts your raw producer counts into reasonable throughput limits. It helps you see the gap between constant operations and how things actualy work in bursts. You specify your number of producers, along with their average event rate. Next, you add in a burst multiplier, which reflects how intense your system’s spikeiness is.
How to Plan Capacity for Your Event Pipeline
Here’s where intuition often fails. Folks will assume that bursts are rare outliers. They’re not: in distributed systems, multiple independent source aligning is the norm. The tool reveals if your existing partition count accommodates that alignment, or not. That’s where disk write speed/disk throughput matter (and so does network I/O).
You might think that a 45% reduction in the payload doesn’t look like much. But multiply this by thousands of event per second and then consider impact this has on your brokers’ network interfaces: will there be enough room left for replication traffic? Or saturation? The compression profile is workload-dependent. In fact, as the reference table illustrates, some workloads is more open to compression than others. CDC feed versus IoT telemetry will differ. Small but repetitive payloads will compress well. Large and complex ones won’t. Know your data type to avoid over-estimating bandwidth requirement.
Theory vs. Another area where theoretical knowledge clashes with operational reality is partitioning. There’s no limit to the number of consumers per group that you can add. Once each partition has an owner, those additional consumer don’t do anything. Many teams reaches a hard ceiling when they get a traffic spike. The calculator will tell you how many partitions you need in order to maintain less than seventy percent use. Leave some headroom for rebalancing and leader elections. Below that line, you have breathing room. Above that line, you’re in trouble by the time the spike occurs.
Adding partitions after the fact is painful as it shuffles around data between brokers. Getting this number correct up front should of saved a lot of operational pain.
Speed vs. Safety is a balancing act that depends on acknowledgment mode. Fire-and-forget will get you maximum throughput, but doesn’t guarantee anything if one of your broker goes down. All-replica acknowledgment provides durability at the cost of latency. Depending on what mode you choose, the tool will adjust throughput estimates accordingly. It accounts for the actual overhead of waiting for consensus. It’s not just a matter of technical preferences… It’s also a matter of business requirements. Payment events require durability. Clickstream data can tolerate losing some points. Mixing these two types of workloads without considering their different needs will lead to risky architecture or wasted resources.
The time spent by consumers is underappreciated. It’s tempting to think about how much data producers push through the system. But don’t forget how long it takes for each event to be parsed, transformed and written by a handler. Broker bandwidth isn’t going to help if your handlers are sluggish. It calculates consumer lag risk by accounting for that. Low? Your consumers will be able to keep pace with peak loads. High? Time to make your code faster. Or maybe add more capacity. Maybe batch more aggressive.
There’s no “right answer” for sizing out an event stream. There’s just a set of trade-offs (cost), durability, speed… That we want to understand. And the tools can help us show that math of trade-offs. The humans still have to make the decision: What kind of loss is acceptable in your system? How much do you want to set up in infrastructure for the one percent worst-case scenario?
It becomes clear if you look at your stream as a system, where there are specific places it will bottleneck. You don’t want to simply make it so events move. You want to make it so they can be moved reliably in pressured conditions. First, recognize that average case math doesn’t apply. Second, plan for the moment when everything comes all-at-once.