Expected Latency Calculator
Estimate mean, p50, and p95 response time from weighted network paths, cache hit and miss behavior, service time, queue delay, and retransmit overhead.
⚙App and Network Presets
Use round-trip measurements if your service waits on request and response together. Use one-way equivalent values only if you already split the path delay.
Expected Latency Results
📊Latency Component Grid
🖧Weighted Path Reference
| Path type | Typical latency | Common cause | Planning note |
|---|---|---|---|
| Same switch LAN | 0.2 to 2 ms | Local Ethernet | Usually below app service time. |
| Wi-Fi or mesh | 3 to 25 ms | Airtime contention | Tail spikes matter more than average. |
| Remote VPN | 25 to 120 ms | ISP route plus encryption | Use a separate weight for remote users. |
| Relay or tunnel | 50 to 180 ms | Extra proxy hop | Cache helps only after path delay is paid. |
⏲Component Targets
| Component | Good range | Watch range | What to tune |
|---|---|---|---|
| Cache hit time | 1 to 10 ms | 10 to 30 ms | Memory cache, local resolver, warm app objects. |
| Cache miss time | 20 to 120 ms | 120 to 400 ms | Database indexes, disk latency, origin distance. |
| Service time | 5 to 40 ms | 40 to 150 ms | CPU saturation, TLS, app middleware, serialization. |
| Queue delay | 0 to 20 ms | 20 to 150 ms | Worker count, database pool, disk queue, link buffer. |
↻Queue and Retransmit Planning
| Signal | Low risk | High risk | Interpretation |
|---|---|---|---|
| p95 / p50 ratio | Under 3x | Over 6x | High ratio means bursts or saturation are hiding behind a normal median. |
| Retransmit rate | Under 1% | Over 3% | Small loss can dominate p95 when the penalty is a full timeout. |
| Queue p95 | Under 50 ms | Over 200 ms | Queue delay grows before obvious failures or packet loss show up. |
| Headroom | 10% to 15% | 0% at peak | Planning without variance makes routine bursts look like incidents. |
💻Common App Profiles
| App profile | Primary bottleneck | Usable p95 target | Best first check |
|---|---|---|---|
| Home Assistant dashboard | Queue and Wi-Fi | Under 150 ms | Check browser waterfall and MQTT broker delay. |
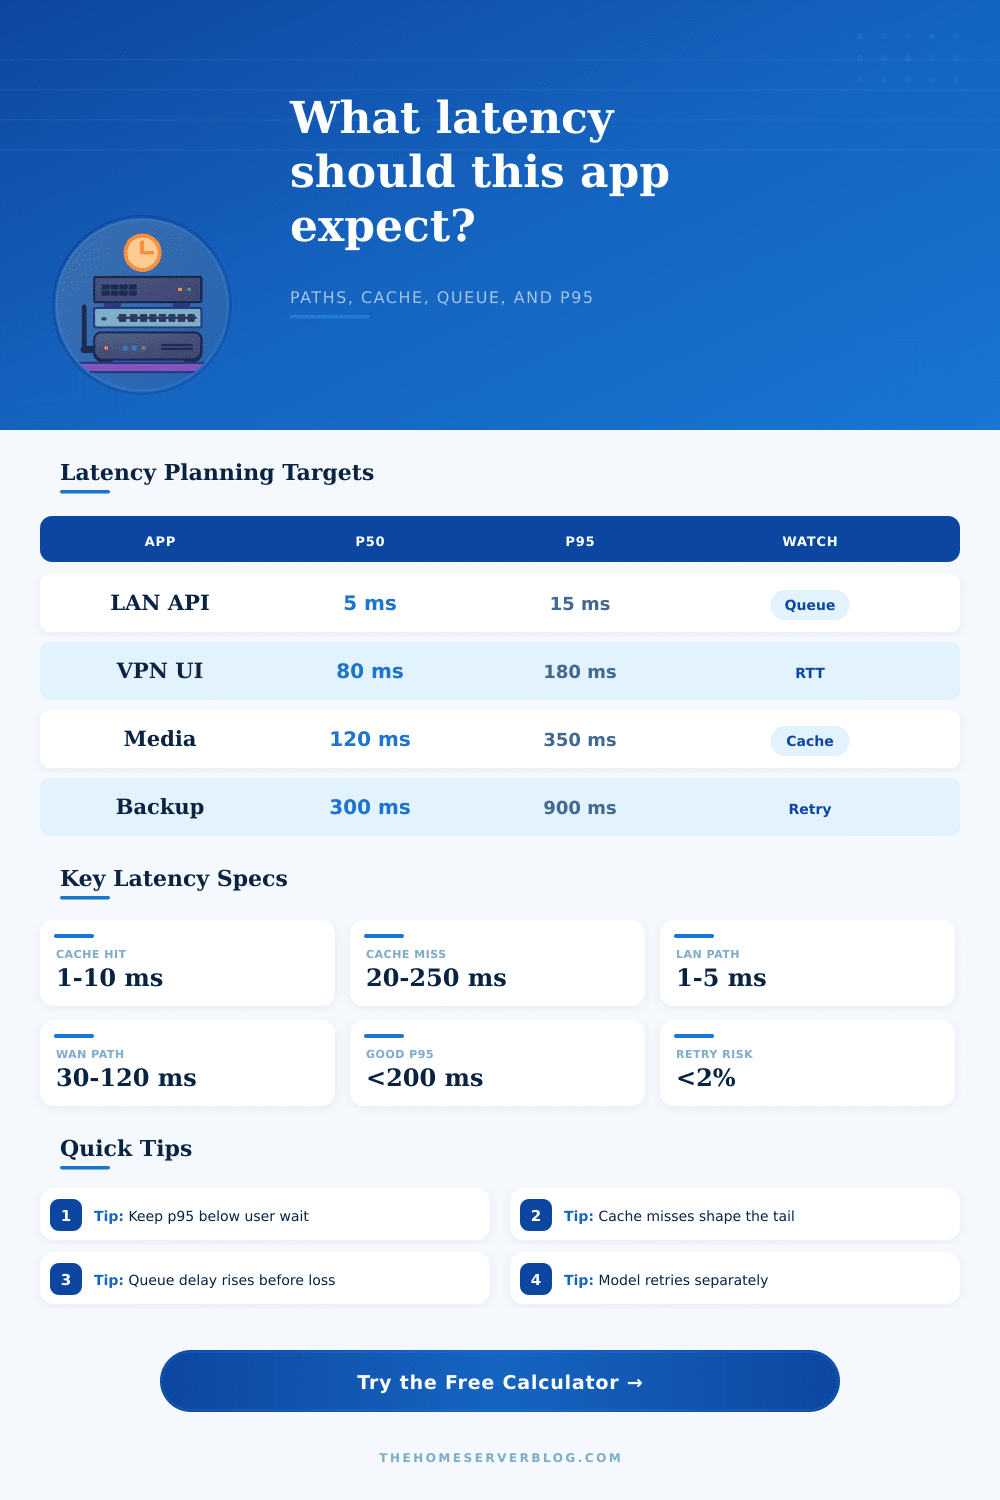
| Plex or media metadata | Cache miss and disk | Under 350 ms | Check thumbnail cache hit rate and storage latency. |
| Game server query | Path and jitter | Under 80 ms | Check route, bufferbloat, and upload saturation. |
| Offsite backup API | WAN and retries | Under 900 ms | Check retransmits, provider region, and retry timeout. |
💡Latency Tips
Latency is the measurement of the time that it take for a request to make its way through a system. Latency is composed of several differents types of delays. The feeling of a delay in your home lab application is likely due to the combination of several delays of that same type.
The calculator included in this article allow you to enter specific number for each of those components of latency to calculate the contribution of each component to the total latency of the system. The first component of latency is known as path latency. Path latency is the time that it takes for data to travel across the hardware of your system, such as switches, Wi-Fi networks, and VPN tunnel.
What Causes Latency and How to Check It
Your home lab systems may include both local and remote systems that is accessed through a VPN, so the average round trip time for your system may not accurately reflect the latency of your network. However, if you weight each of your network paths by the amount of traffic that pass through each path each unit of time, the calculator will allow you to see if any of your slow network paths are increasing the average latency of your system. The second component of latency is known as cache behavior.
Cache behavior introduce a latency due to the time required to access your data through the database or disk of your system. If the system recognize the information that it is requesting, it can retrieve that information quickly. However, if it does not recognize the information that it is requested, the system will introduce the latency of database or disk access into the overall latency of the system.
Thus, if the rate at which the system miss items in its cache is too high, the latency of the system will increase. Adding an in-memory cache layer to the system is a better way of reducing latency than attempt to reduce the latency of the network by a few milliseconds. The third component of latency is known as service time and queue delay.
Service time is the length of time that it takes for the system to perform the services required to fulfill the request, such as utilize the CPU or performing TLS handshakes. Additionally, many request attempt to use the same database connection by the system, leading to queue delays for those requests. The calculator allows you to input separate p50 and p95 latency values for the queue delay.
By entering these separate latency values, you can see how increased traffic to your system increases your p95 latency without increasing your p50 latency. Thus, even if your system averages a low latency response to requests, a high p95 latency can indicate that your system are unable to handle high volumes of traffic. The fourth component of latency is known as the number of retries that the system must perform to fulfill the request.
If a request fails to be fulfilled by the system, the system may automatically send it again. Thus, even with a small rate of the number of requests that must be sent again, the latency of the system may significant increase. The system can alter both the retry rate and the penalty for each retry.
For instance, fixing packet loss in the network can reduce the retry rate, and shortening the amount of time that a request is allowed to timeout can reduce the penalty for each retry. Each of these changes will impact the p95 latency of the system. However, each of these changes have different technical fixes to the system.
The final component of latency to consider is headroom. Headroom is the amount of latency that is permitted into the system to account for data traffic that is not steady through the network. Ten or fifteen percent of latency can be added to the calculation.
By adding headroom to the calculations, the system can handle increases in traffic. The calculator provides both the expected latency and the p95 latency of the system so that you can ensure that the system’s latency remains within your target limit. The tables provided at the end of the article provide the range of latencies for different levels of systems.
However, these are not limits for system latency. If the calculated latency for your system is within the target limits for your system, and if the miss rate for your cache is low, the system is functioning in its normal capacity. However, if the calculated latency for your system reaches the target limits for latency, and if that is the result of an increased queue delay or retry penalty, you must address those specific area of your system.
Finally, your home lab systems may change over time. New users of the system may have been added, or new service may have been added to the system. These changes will impact the weights and miss rate of the system.
Thus, the numbers for your home lab system should of been entered again into the calculator after any changes to the system. By running the numbers again, you can ensure that the latency of the system is still within the latency that you calculate for it when building your system. By entering the numbers in this calculator as a regular habit, you will be able to catch any increases in latency prior to them becoming significant problems for your users of your system.