HomeServerBlog reliability FIT planner
Failure Rate FIT Calculator
Convert component FIT into adjusted system FIT, equivalent MTBF, mission failure probability, and annual expected failures with temperature factor, environment factor, duty cycle, confidence factor, annual hours, operating age, component count, and redundancy mode.
1Reliability presets
2FIT, derating, and mission inputs
Calculation breakdown
Risk reading
3Live reliability cards
Before redundancy credit, but after derating and duty cycle.
Chance of at least one failure during annual powered hours.
Mission hours multiplied by duty cycle for active exposure.
Operating hours already accumulated in this modeled boundary.
4Component FIT grid
Control boards
BMCs, switch ASIC support logic, RAID cards, embedded controllers, and motherboard power logic.
50-350 FITStorage devices
HDDs, SSDs, cache devices, and removable backup disks. Workload and heat can dominate field behavior.
100-800 FITFans and mechanics
Moving parts, fan bearings, sled connectors, latch sensors, and assemblies exposed to dust or vibration.
250-1500 FITPower chain
PSUs, VRMs, UPS control boards, transfer relays, rectifier modules, and high-stress capacitors.
200-2000 FIT5Reliability tables
Mission time sensitivity
| Mission window | Failure probability | Reliability | Expected failures |
|---|---|---|---|
| Calculate | 0% | 100% | 0 |
This table uses the adjusted system FIT from the current inputs.
Component count sensitivity
| Components | Series FIT | Selected-mode FIT | Mission risk |
|---|---|---|---|
| Calculate | 0 | 0 | 0% |
Required series components add failure rates before the redundancy mode is applied.
Temperature and environment guide
| Condition | Temp factor | Env factor | Planning note |
|---|---|---|---|
| Clean office shelf | 0.8 to 1.0 | 0.85 to 1.0 | Best for quiet router, NAS, and lab nodes. |
| Warm network closet | 1.2 to 1.6 | 1.0 to 1.25 | Check intake temperature and dust monthly. |
| Garage cabinet | 1.5 to 2.5 | 1.25 to 1.55 | Use spares and alerting for moving parts. |
| Remote edge space | 2.0 to 4.0 | 1.55 to 2.10 | Derate strongly when access is slow. |
FIT, MTBF, and redundancy reference
| Reference | Formula | Use case | Watch item |
|---|---|---|---|
| FIT to rate | FIT / 1,000,000,000 | Convert vendor FIT into failures per hour | Boundary must match the part list |
| Rate to MTBF | 1 / failure rate | Equivalent average time between failures | Not a guarantee for one device |
| Series model | Sum component rates | Single required path or no redundancy | Every extra required part adds risk |
| Redundant model | Approximate path risk | Mirror, N+1, or 2N sanity check | Common cause failures are not removed |
6FIT calculation tips
Ever build a server that looked perfect? Spent time lining up the cables, making sure the LEDs was synced. Ran perfectly for months. And then one Tuesday night the bearings in a fan fail. The system overheats and dies. That million hour expectation seem off.
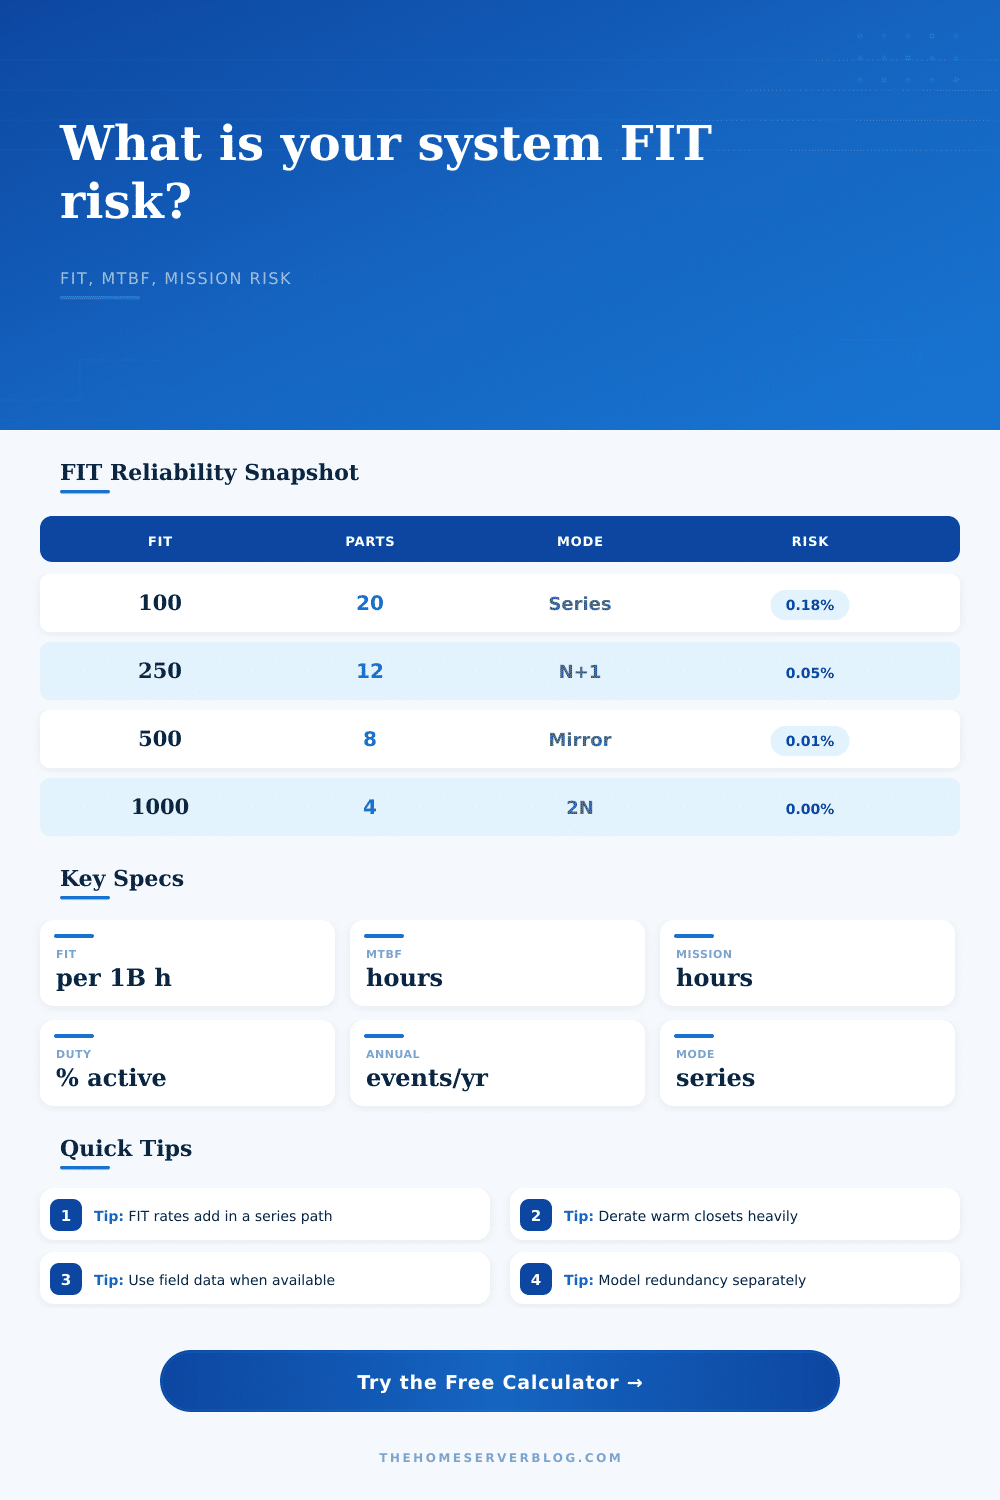
That’s why FIT rates are important, and they’re more important than component pricing. FIT stands for failures in time. How many times will a component fail for every billion hours of use? It’s a statistical average, and it doesn’t tell you when your particular hard drive will fail. The calculator figures this out for you.
Why Servers Fail and How to Plan
The magic is in what you include within the system boundary. Most folks think they include all parts in the box. Include only those parts which prevent stopping the mission. If the power supply fails, the server remains powered up thanks to redundant power supply. That secondary supply is not part of the critical path to keep the system up. Sure, it’s in the same chassis as the other components, but it doesn’t cause the system to stop.
Heat accelerates failures. Heat is bad for electronics. What may be rated at 100 FIT in a cool room can spikes to 300 FIT if placed in a hot closet. You can include environmental factors, such as temperature, in the tool. Those multipliers aren’t random numbers. They represent accelerated aging physics. Hotter things ages silicon faster. Dust is insulating, trapping heat. It’s a feedback loop that simple ratings don’t account for.
Adding parts increase risk. Every component is a point of failure. That’s why redundancy doesn’t equal immortality, just time. It changes the math. Mirror drives? There are N+1 power supplies. All those things reduces the probability of total system failure. But they won’t save you from common cause failures. A power surge fries the whole board. A bug in firmware bricks all your SSDs. In that case, your mirrored array isn’t going to help.
That’s where the calculator shows you your redundancy mode and series path risk. It makes you go verify that your backups are independent.
As we see from the reference table the probability changes over mission time. Even if you have a high FIT part on a short mission it’s still low risk. On a long mission there is exposure. The probability of failure rises exponentially, tiny increments of time may result in large jumps up in risk. This is why cloud providers rely on such massive redundancy and predictive replacement. They know things are going to break. They build their system to survive the breakage.
This is all about taking controlled risks for a small office or home lab. There’s no such thing as zero risk. You can use the number of drives expected to fail per year output to determine how many spare drive to maintain. If it predicts one failure every two years, then sure, get a spare. If it predicts a failure every five years, well…maybe you just tolerate the downtime.
The confidence factor on the tool lets you tune for your level of uncertainty. If you’re plugging in generic data, increase the confidence factor and you’ll have a more conservative guess. The trade-off in reliability engineering is your peace of mind versus dollars. You could go with less expensive hardware and tolerate a greater chance of failure. Or you could purchase an enterprise grade component that decreases your failure rate.
There’s no decision made by the calculator. It takes the guess work out of math. It leaves the decision to you: how much failure can you tolerate?
Let’s go back to that server rack. Those blinking lights look pretty cool… but then there’s the parts list. Point out the weak links. Figure out how the heat escapes. Plan on getting dusty. Stop hoping it will work. Start planning for it not to. Know the numbers. Then you’ll stop hoping it won’t fail, you’ll plan for failure. And when it fails, you’ll know why. And be prepared.