HomeServerBlog high availability planner
Redundancy Availability Calculator
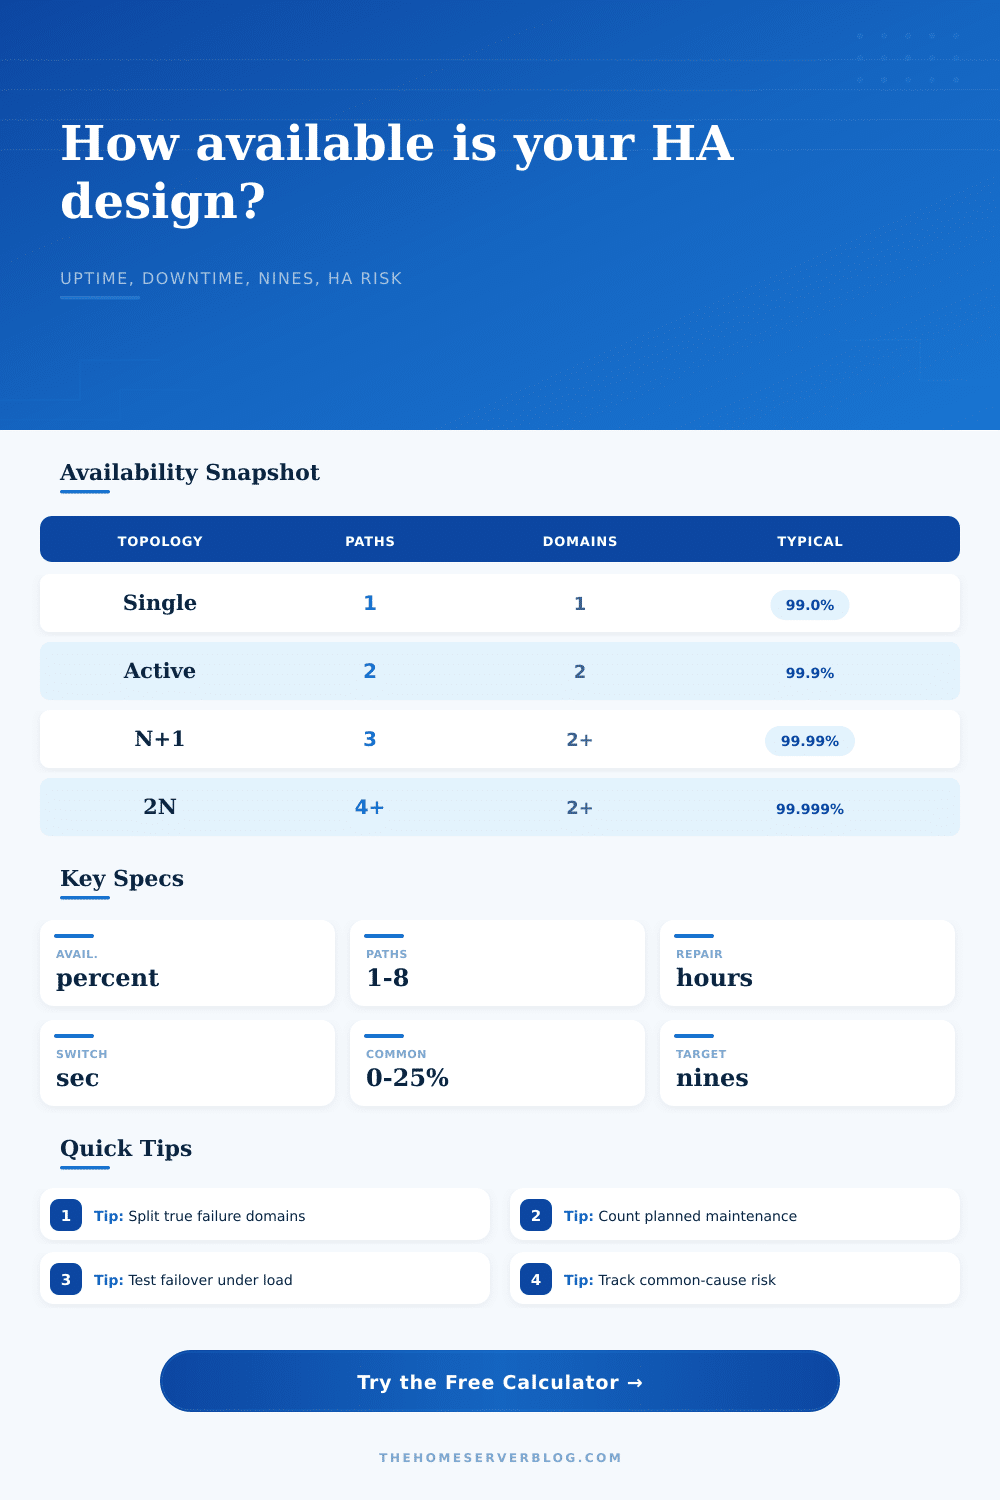
Estimate service availability for single path, active-passive, active-active, N+1, N+2, and 2N designs using component availability, redundant paths, failure domains, repair time, switchover time, common-cause factor, maintenance windows, load sharing, annual hours, and target nines.
1HA design presets
2Availability and failover inputs
Availability breakdown
Risk notes
3Live HA breakdown
Residual outage after redundant paths are applied.
Shared fault exposure that redundancy cannot remove.
Maintenance windows counted as visible service loss.
Brief interruption from failover events.
4Redundancy topology grid
5Availability tables
Calculated downtime by source
| Source | Hours/year | Minutes/year | Share |
|---|---|---|---|
| Calculate | 0 | 0 | 0% |
Path count sensitivity
| Paths | Availability | Downtime | Nines |
|---|---|---|---|
| 1 | 0% | 0 h | 0 |
Nines downtime reference
| Target | Availability | Downtime/year | Downtime/month |
|---|---|---|---|
| Two nines | 99% | 87.6 h | 7.3 h |
| Three nines | 99.9% | 8.76 h | 43.8 min |
| Four nines | 99.99% | 52.6 min | 4.38 min |
| Five nines | 99.999% | 5.26 min | 26.3 sec |
| Six nines | 99.9999% | 31.5 sec | 2.63 sec |
HA topology planning guide
| Topology | Best use | Strength | Watch item |
|---|---|---|---|
| Single path | Lab or noncritical service | Simple operations | One fault causes outage |
| Active-passive | Firewall, router, controller pair | Clean failover target | State sync and split brain |
| Active-active | Web, DNS, apps, links | Uses all capacity | Surviving capacity and sessions |
| N+1 or N+2 | Compute, storage, hypervisor pool | Maintenance friendly | Cluster quorum and rebuild time |
| 2N | Power, WAN, site pair | Duplicate train | Shared operators and dependencies |
6Availability planning tips
All infrastructure failure originate from an innocent beginning. There was a moment where you had a need for redundancy, so you purchased the redundant power supply. Then you set up your active-passive pair and the green lights blinked happily together. At least now you’re secure. You have a backup.
Redundancy is hardware. Availability is math. And that math’s typically less generous then your gut might tell you. That’s why there is a calculator; it’ll do the math for you, and turn all of that blinking light into something more tangible: downtime and uptime numbers.
Why Redundancy Is Not Enough
To understand why that matters is really the trick. Five nines availability means 99.999 percent, which sounds great until you remember that’s still less than six minutes down time a year. Three and four nines is reasonable targets for most small office/home lab situations, giving them some breathing room. But achieving that takes more than simply buying twice as much hardware; it also mean understanding how those failure domains interrelate.
Placing your main and backup server on the same network switch doesn’t count as two separate path; it counts as one path where you paid an awful lot for a spare. This is where the tool comes in, allowing you to define distinct failure domain. The calculator will assume if you plug in two domains that there is no chance of both of those paths being taken down by a single rack failure or switch crash. It’ll punish your availability score to match if you plug in one domain. That makes sense because that distinction is more important than component reliability.
And then there’s the silent assassin of high availability: common cause failure, the thirty percent factor or however large a fraction you want to call it. Perhaps both paths run firmware with the same bug. Perhaps they’re both dependent on the same upstream provider. Perhaps person who operates them makes the same configuration error at two o’clock in the morning. The calculator makes you own up to that fact. Adding redundancy doesn’t solve a shared dependency; it only solves independent failure.
But it is a small thing that matters. Maintenance windows are another area where theoretical availability hit the wall of reality. In theory you have zero downtime while you patch. In reality you reboot. Then you check things, then you double check. All those planned events can be counted as downtime, because they help determine how long maintenance lasts and how much it affects service. If you have five percent service loss for every hour of maintenance, which happens four times a year, that’s going to add up. That’s going to show up in the downtime column. Not dramatically but if you’re counting down your nines, it eats away at them. The chart on the page shows just how close four nines gets you versus five. And there isn’t much room between them. Neglect the little interruptions and you’ll find yourself falling short.
The last variable which separates user experience from theory is failover speed. Even if you’re technically available, it doesn’t mean you feel available. If your switchover take thirty seconds, your database connection drops. Your users reload their page, and the calculator says you’ve lost thirty seconds. But you know, that’s what thirty seconds feels like to your user. It multiplies it out for you, times the number of expected event per year. So if you have a flappy, flaky link that flaps once per month, those thirty seconds turns into five and a half minutes of lost uptime. That is half of your five-nines budget.
Maybe you fix the link, maybe you shrug and take your availability down. It’s up to you, but at least you know how much it costs. You don’t need perfect. You just want to know what it looks like and how to move those levers that matter. Adjust the different areas or causes and observe which one moves the needle most. Surprisingly often, fixing the shared dependency will give you as much (or even more) availability than another bought server. You know why it works. You won’t have to guess anymore. Now planning.