HomeServerBlog optical link worksheet
Fiber Connector Count Loss Calculator
Estimate how LC, SC, MPO, APC, UPC, patch panel, adapter, length, wavelength, inspection, and reserve choices consume a transceiver optical budget before you light a home lab or small network fiber run.
1Connector loss presets
2Connector count, fiber, and budget inputs
Loss breakdown
Budget status
3Quick connector loss cards
Direct pairs, panel faces, and adapters in the calculated path.
All mated-pair loss before fiber attenuation is added.
Length multiplied by the selected wavelength attenuation.
Total loss divided by the transceiver optical budget.
4Connector type comparison grid
5Connector loss reference tables
Typical mated-pair insertion loss by connector
| Connector | Typical planning loss | Conservative field value | Where it appears |
|---|---|---|---|
| LC UPC | 0.20 to 0.35 dB | 0.50 dB | SFP/SFP+, switch uplinks, home lab patch panels. |
| SC UPC | 0.25 to 0.40 dB | 0.50 dB | Older media converters, wall boxes, and single-mode jumpers. |
| SC APC | 0.20 to 0.35 dB | 0.50 dB | ONT, PON, and low-reflection handoff points. |
| ST UPC | 0.30 to 0.50 dB | 0.75 dB | Legacy multimode panels and industrial shelves. |
| FC UPC / APC | 0.25 to 0.45 dB | 0.60 dB | Test gear, telecom shelves, and vibration-prone hardware. |
| MPO / MTP standard | 0.35 to 0.75 dB | 0.75 dB | 40G, 100G, trunk cables, and breakout cassettes. |
| MTP Elite | 0.20 to 0.35 dB | 0.50 dB | Dense low-loss trunks and parallel-optic lab fabrics. |
| E2000 APC | 0.10 to 0.30 dB | 0.40 dB | Carrier handoffs, shuttered panels, and reflection-sensitive paths. |
| MU UPC | 0.25 to 0.40 dB | 0.60 dB | Dense older telecom shelves and compact patch frames. |
| CS / SN duplex | 0.20 to 0.35 dB | 0.50 dB | Modern high-density transceiver and patching systems. |
Polish, reflection, and mixing guidance
| Endface | Connector color cue | Loss impact | Planning note |
|---|---|---|---|
| UPC | Blue for OS2, aqua for multimode | Baseline mated-pair loss | Common for Ethernet optics and ordinary patching. |
| APC | Green connector body or boot | Usually similar insertion loss | Lower reflection; common in PON and RF overlay links. |
| Legacy PC | Varies by plant | Add about 0.05 dB | Use conservative values unless faces are tested. |
| Mixed APC to UPC | Green mated to blue | Large modeled penalty | Avoid this; it can damage faces and create heavy loss. |
| Unknown polish | Unlabeled adapter or jumper | Add inspection penalty | Inspect, clean, and verify before reducing reserve. |
Fiber attenuation by wavelength
| Fiber and wavelength | Planning attenuation | Typical link use | Distance sensitivity |
|---|---|---|---|
| OS2 at 1310 nm | 0.35 dB/km | 1G, 10G LR, BiDi, many home backbone runs. | Connector loss usually dominates short links. |
| OS2 at 1490 nm | 0.25 dB/km | PON downstream and some BiDi optics. | Useful for longer passive plant planning. |
| OS2 at 1550 nm | 0.22 dB/km | Longer single-mode optics and WDM links. | Lower fiber loss, still watch dirty connectors. |
| OM3 at 850 nm | 3.0 dB/km | Short-reach SR transceivers and legacy multimode. | Distance can matter even inside larger buildings. |
| OM4 at 850 nm | 2.3 dB/km | 10G/25G/40G/100G SR in short pathways. | Check standard distance limits separately. |
| OM4 at 1300 nm | 0.6 dB/km | Specialized multimode optics and test cases. | Less common; verify transceiver specification. |
Patch stack examples and connector count
| Path layout | Direct pairs | Panel pairs | Practical note |
|---|---|---|---|
| Switch to nearby device jumper | 2 | 0 | Two transceiver interfaces with one patch lead between them. |
| Rack panel to rack panel | 2 | 4 | Two panels add front and rear mated pairs on each side. |
| Wall box through closet panel | 2 | 2 | One panel plus one endpoint adapter is common in small builds. |
| MPO trunk through cassettes | 2 | 4 | Cassettes and trunk adapters can use budget faster than expected. |
| Carrier handoff cross-connect | 2 | 6 | Provider panel, building meet-me panel, and customer rack panel. |
Ten connector preset reference
| Preset | Connector | Typical budget | Modeled purpose |
|---|---|---|---|
| LC UPC Closet | LC UPC | 6 dB | Short 10G SFP+ run through a small home rack patch panel. |
| SC APC ONT | SC APC | 28 dB | Fiber provider or PON-style path with angled connectors. |
| ST Legacy Lab | ST UPC | 3.5 dB | Older multimode patch bay with higher connector uncertainty. |
| FC Test Bench | FC UPC | 10 dB | Lab test gear with threaded connectors and short OS2 patching. |
| MPO-12 SR4 | MPO-12 | 1.9 dB | Parallel SR optic where connector loss must stay very low. |
| MPO-24 Trunk | MPO-24 | 4 dB | High-density trunk with cassettes and multiple adapter faces. |
| E2000 APC | E2000 APC | 12 dB | Low-reflection carrier-style handoff or lab measurement path. |
| MU Shelf | MU UPC | 5 dB | Dense shelf connector stack in older telecom equipment. |
| CS Breakout | CS UPC | 3 dB | Modern compact duplex breakout for high-density switches. |
| SN Lab Spine | SN UPC | 4 dB | Dense spine patching with compact duplex connectors. |
6Fiber connector loss tips
This calculator estimates insertion loss and optical margin for planning. Confirm actual links with calibrated light-source/power-meter or OTDR testing, and follow the transceiver, cable, and connector manufacturer limits.
You pull patch cord from switch and plug it into transceiver. The link light remains dark. Check the cable. Check the switch port. Check the other end. Everything check out fine. Oh wait, then you recall the dust. It’s a microscopic road block, sitting atop the ferrule, preventing the light from traveling all the way through dozens of connector to reach its destination.
Fibre optics are a game of managing light, and light is stubborn. It doesn’t care what your best intentions is. Light cares about the math of signal loss. It also cares about how clean it is and what type of polish are used. That’s why connector count matter so much. It’s the difference between a working network and a debugging nightmare.
How to Fix Your Fiber Optic Light
Define your physical path and the calculator above will do the math for you. Input the number of mated pairs, choose your connector type, and define your wavelength. It’ll subtract the resultant loss from your transceiver budget. Keep that margin in the black. Anything less than zero mean your signal isn’t strong enough to register a one. Time to get some better optics, clean those things up, use fewer connectors.
A lot of home lab builders don’t include their patch panel. Count two end-to-end jumpers and ignore the two mating surfaces inside the panel itself? That add two pairs to the loss equation. It is a small detail, but it matters. The tool consider this because it lets you input separate panel counts from direct patch cord counts.
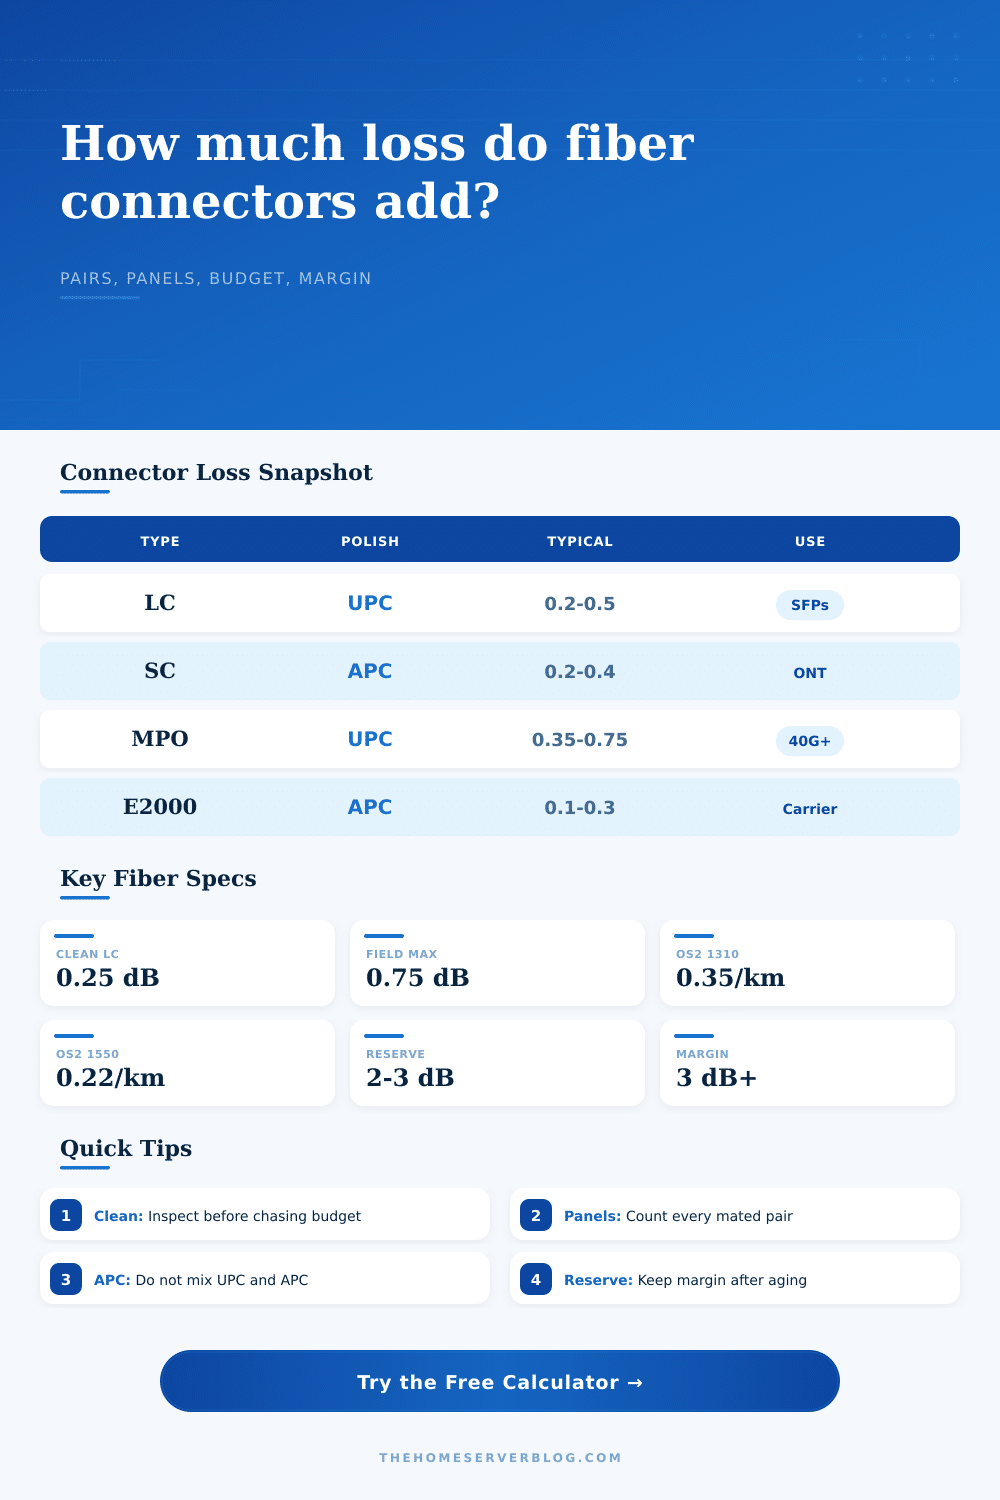
The hidden variable are reflection. Connectors like these (green) with an angled polish are made to reflect light back into the cladding; that’s what APC stands for. Those is typically blue (UPC) and will send some of light back towards the source. Mixing the two types are a huge mistake. Because of different angles, there will be air gaps that scatter the light. This gets heavily penalized by the calculator, and rightly so. In fact in a real rack, mixing polishes can not only cause complete failure but also damage the ferrule.
Low reflection is good for long distances and high speed links. APC is frequently required for PON or RF video applications. For short runs at 10G from one rack to another, UPC is fine. Just stay consistent.
The page has a clear reference table showing the range of typical losses per family. The simple bit is fiber attenuation. At 1310 nanometers in single mode with OS2, it’s around 0.35 dB/km. For runs under ten kilometers, that’s negligible. The budget is eaten by connectors. A standard LC pair might lose 0.25 decibels. Five pairs adds up to one decibel. Then there are the adapters, then the inspection penalty of the dirt you haven’t found yet. Add them all together and it add up quickly.
Transceiver budgets is shrinking. Tight-margin cheap SFP+ modules abound. High-end long-range optics has more headroom. But cost more as well. You need to balance link reliability with component cost.
The first rule of cleaning cable is that you have no margin for error. One piece of dust across a mating face will destroy the link. Inspectors and click-cleaning pens is cheap insurance. Inspection penalty field exist in the calculator. Add it. Bump it up if you’re running older cable or in a dusty server room. That makes you should of think about real life instead of lab conditions.
Margin is smart. Connectors loses more signal as they age. Temperature swings impact performance. Having two or three decibels of your budget held back mean the link will work next year.
Imagine your fiber path as a water pipe. A valve is the connector. Every valve are resistant. Too many valves and the water won’t go through a big pipe. It’s simple math. But doing it in real life isn’t easy.
Count the pairs. Choose the polish. Check the cleanliness. Verify the budget. The math part come from the calculator. Your job is to provide the facts. Enter optimistic numbers and recieve an optimistic result. Account for the dust, account for the adapters, account for the panels and you’ll have a link that stays lit.
Begin at the beginning. Clean those ferrules. Count every one of those mates. Allow for error. The light will follow.