Fiber Loss Budget Calculator
Estimate optical link attenuation from fiber type, wavelength, route distance, connector pairs, splice count, splitter loss, transceiver Tx power, receiver sensitivity, and safety margin.
🖧Fiber link presets
⚙Link inputs
Use the installed cable route, not straight-line distance.
📊Optic and fiber spec grid
📚Fiber attenuation reference
| Fiber type | 850 nm | 1310 nm | 1550 nm / note |
|---|---|---|---|
| OM3 multimode 50/125 | About 3.0 dB/km | About 1.0 dB/km | Short-reach data center links |
| OM4 multimode 50/125 | About 3.0 dB/km | About 1.0 dB/km | Better modal bandwidth than OM3 |
| OM5 wideband multimode | About 3.0 dB/km | About 1.0 dB/km | SWDM-ready multimode trunks |
| OS2 single-mode G.652.D | Not normally used | About 0.35 dB/km | About 0.22 dB/km at 1550 nm |
| G.657 bend-insensitive SM | Not normally used | About 0.35 dB/km | About 0.22 dB/km at 1550 nm |
| Legacy 62.5/125 multimode | About 3.5 dB/km | About 1.5 dB/km | Check old plant carefully |
🔌Connector, splice, and splitter loss table
| Component | Typical loss | Conservative planning | How to count it |
|---|---|---|---|
| LC or SC mated pair | 0.2 to 0.5 dB | 0.5 dB per pair | Count both ends and patch panels |
| Fusion splice | 0.05 to 0.1 dB | 0.1 dB each | Count tray splices and repairs |
| Mechanical splice | 0.2 to 0.5 dB | 0.3 dB each | Use higher value for field repairs |
| 1:8 splitter | About 10.5 dB | 11 dB | Add once in the downstream path |
| 1:32 splitter | About 17.0 dB | 17.5 dB | Common GPON split ratio |
| CWDM mux/demux pair | 1.0 to 3.0 dB | Use module datasheet | Add mux plus demux loss |
📡Optical transceiver planning table
| Optic class | Nominal reach | Typical wavelength | Planning note |
|---|---|---|---|
| 10GBASE-SR | 300 to 400 m on OM3/OM4 | 850 nm | Low budget, short multimode runs |
| 10GBASE-LR | 10 km on OS2 | 1310 nm | Common campus and building fiber |
| 10GBASE-ER | 40 km on OS2 | 1550 nm | May need attenuation on very short links |
| 25GBASE-LR | 10 km on OS2 | 1310 nm | Check receiver sensitivity by vendor |
| GPON Class B+ | 20 km class | 1490 / 1310 nm | Splitter loss dominates the budget |
| XGS-PON N2 | 20 km class | 1577 / 1270 nm | Higher budget for larger splits |
| BiDi 20 km | 20 km on one strand | 1310 / 1550 nm | Match A/B optic wavelengths |
🏠Common project size table
| Project | Typical distance | Passive elements | Margin focus |
|---|---|---|---|
| Rack-to-rack OM4 trunk | 30 to 150 m | 4 to 8 connector pairs | Connector cleanliness matters most |
| Campus building LR link | 1 to 8 km | Patch panels plus splices | Distance and splice records |
| Metro ER span | 15 to 40 km | Outside plant splices | Rx sensitivity and overload window |
| GPON 1:32 serving area | 1 to 20 km | Splitter plus drop connectors | Splitter loss dominates |
| CWDM home lab uplink | 2 to 20 km | Mux, demux, patch panels | Add passive filter insertion loss |
| Industrial SM fiber run | 0.5 to 5 km | Patch, splice, repair loops | Leave field repair allowance |
When fiber optic link failures occurs, they are typically not dramatic. The failure of a fiber optic link usually means that the data signal containing light dont contain enough power to be processed by the receiver at the other end of the link. If the link does not have enough power in its data signal, the link will either drop data packets or fail to establish a connection with the device that is attempting to connect.
Many link failures is caused by the fact that the individual did not calculate the loss budget for the link, instead using optimistic number to guess the loss budget. To prevent link failures caused by insufficient loss budgets, the individual should calculate the number of connector, splices, and fiber split points that will be encountered along the link before the fiber is installed. Loss of signal power in fiber optic links is caused by the phenomenon of fiber loss, wherein the light signal lose some of its power as it travels through the glass of the fiber.
How to Prevent Fiber Optic Link Failures
The amount of power that the signal loses depends in part upon the distance over which the signal travels; the longer the distance that the signal travels through the fiber, the more signal power is lost. In addition to distance, the power loss also varies with the wavelength of the light signal that is transmit along the fiber, and the type of fiber that is used to transmit those signals. For example, multimode fiber has more power loss than single mode fiber, which is why people use multimode fiber primarily in connections within buildings, and single mode fiber is used to link buildings to one another over longer distances.
The difference in the power loss between these two types of fiber allows the transceiver devices at each end of the link to recieve the transmitted signal. Loss of signal power is also caused by the number of connectors and splices that is along the link. Each time that two optical fibers connects to one another at a connector or splice, some of the light signal reflects and does not follow through to the connected fiber.
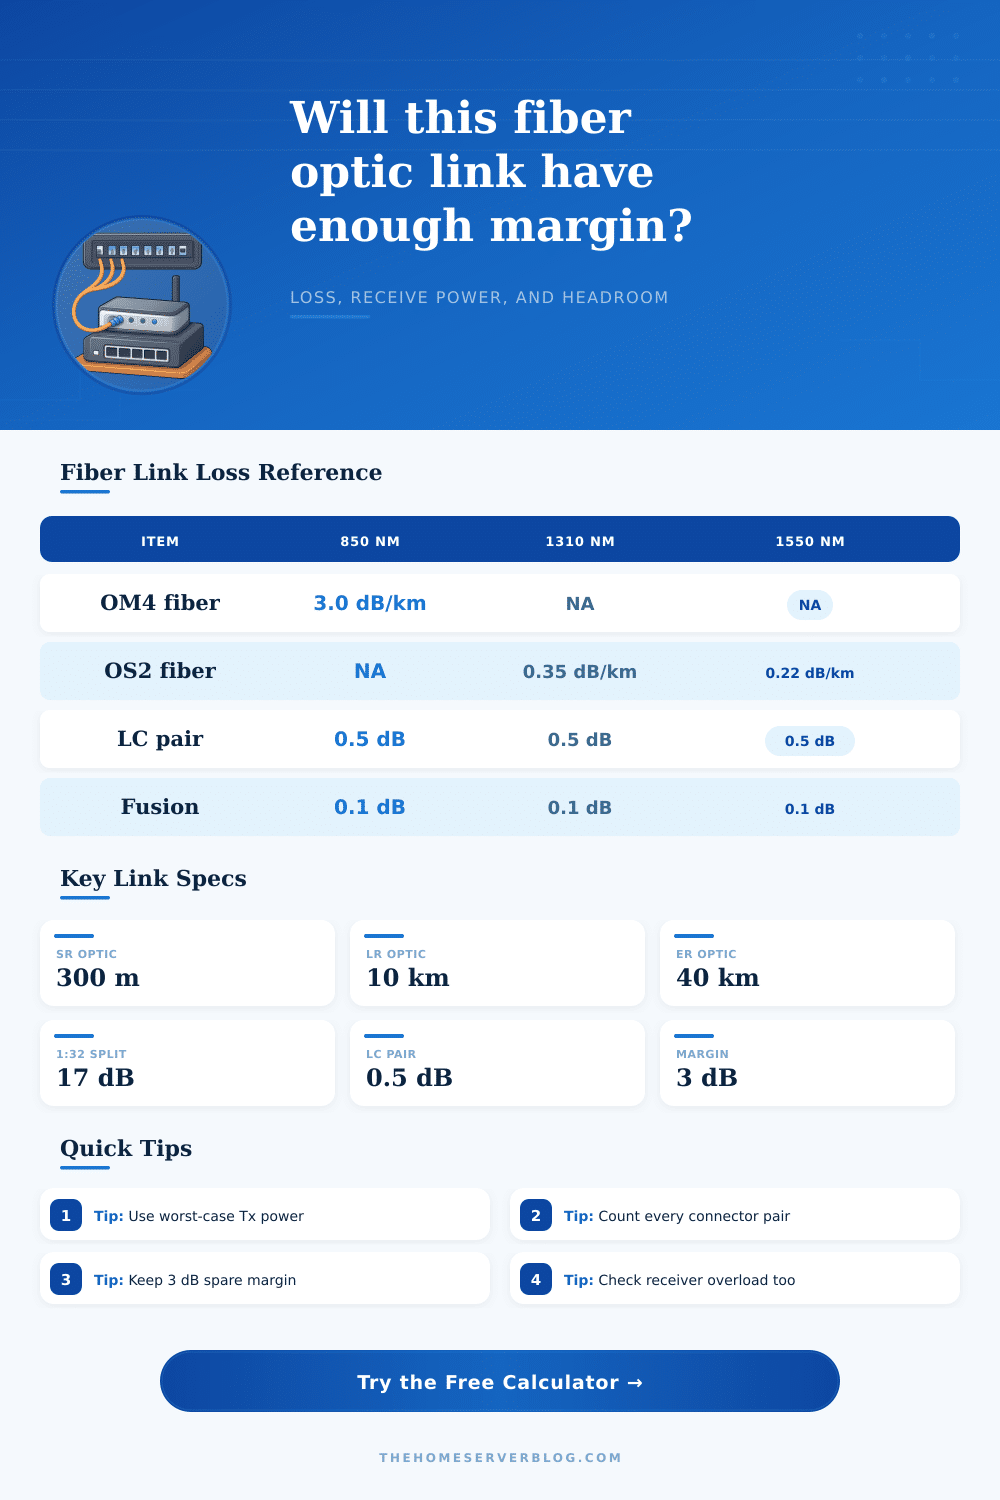
The loss of signal power caused by these connections is referred to as a loss of signal power. For instance, a pair of clean LC connectors may lose half a decibel of signal power; however, the typical fiber link will contain many such pair of connectors. Furthermore, loss of signal power is also experienced at fusion splices; the longer the link, the more fusion splices will occur along the link.
These losses can be calculated in order to ensure that losses due to connectors and splices are not treated as afterthoughts in the building of the link. Loss of signal power is also caused by fiber splits. For instance, a 1:32 splitter will consume approximately seventeen decibels of signal power.
This signal loss is unavoidable and is one of the factor that will dictate the length of the link, and which types of transceivers should be used in the link. The difference between the optical power of the transmitter and the sensitivity of the receiver establishes the link budget for the link. The optical power of the transmitter is the strength of the signal that the transmitter produces.
The sensitivity of the receiver is the strength of the signal that the receiver must receive. The greater the losses of signal power along the link, the smaller the link budget for the link. Should the link budget become too small, the link will not be reliable in its transmission of data.
When calculating the link budget for the link, it is important to use the worst-case numbers from the data sheet for each component of the link. For instance, fiber loss can vary according to the wavelength of the light signal that is transmitted through the link; the loss of signal power at an optical connector can vary according to the cleanliness of the connector and the way in which that connector is polished. Furthermore, the specifications for opto-transceivers can be different than each vendor of those devices, as well as within each vendor for links of different data rates.
By using the worst-case numbers for signal loss for each component, it is ensured that the link will be able to survive those losses in the field. The length of a fiber link is often longer than the distance between the two device that are to be connected. For instance, the link will have to travel within conduits, risers, and trenches in the earth.
Furthermore, the link may have to travel to an industrial site to connect the devices, adding to the length of the link. The link budget calculator can calculate the length of the link to account for these factor. In certain instances, the link may experience overload, which is the phenomenon that occurs when the transmitter along the link is too strong for the receiving end of the link.
For instance, if the link is very short, but the transmitter along the link utilizes long-range optics, the light signal may be so strong at the receiving end of the link that the signal is distorted. In this case, the solution to the problem is to add fixed attenuation to the link. However, the link should of been designed to account for this problem in the initial design of the link.
During installation of the link, it is common to discover small problems with the link that were not accounted for in the mathematical model that calculated the link budget. For instance, a fiber link can experience signal loss due to the presence of dust on a connector, a kink in the fiber, or the use of a substituted patch cord. These problems may not be accounted for mathematically, but they can ruin the reliability of the link if the link is too marginal for the data that is to be transmitted.
In these cases, it is important for the link to have at least three decibel of headroom for these problems. Running the calculations for a link prior to ordering the fiber optic cable will allow the link designer to decide on the number of splitters to use, the types of transceivers to purchase, and whether an outside-plant route will require additional splice closures. The cost of fixing these problems once the link is installed in the field is typically more costly than fixing the problem during the design stage.
Thus, ensuring that the link includes some margin for losses along the link will ensure that it will pass the link budget test, and remain stable in the face of changes in the temperature along the link.