Fiber Splice Loss Budget Calculator
Estimate total optical insertion loss, receive power, margin after safety reserve, and maximum reach for spliced home lab, campus, and rack fiber links.
Fiber splice loss result
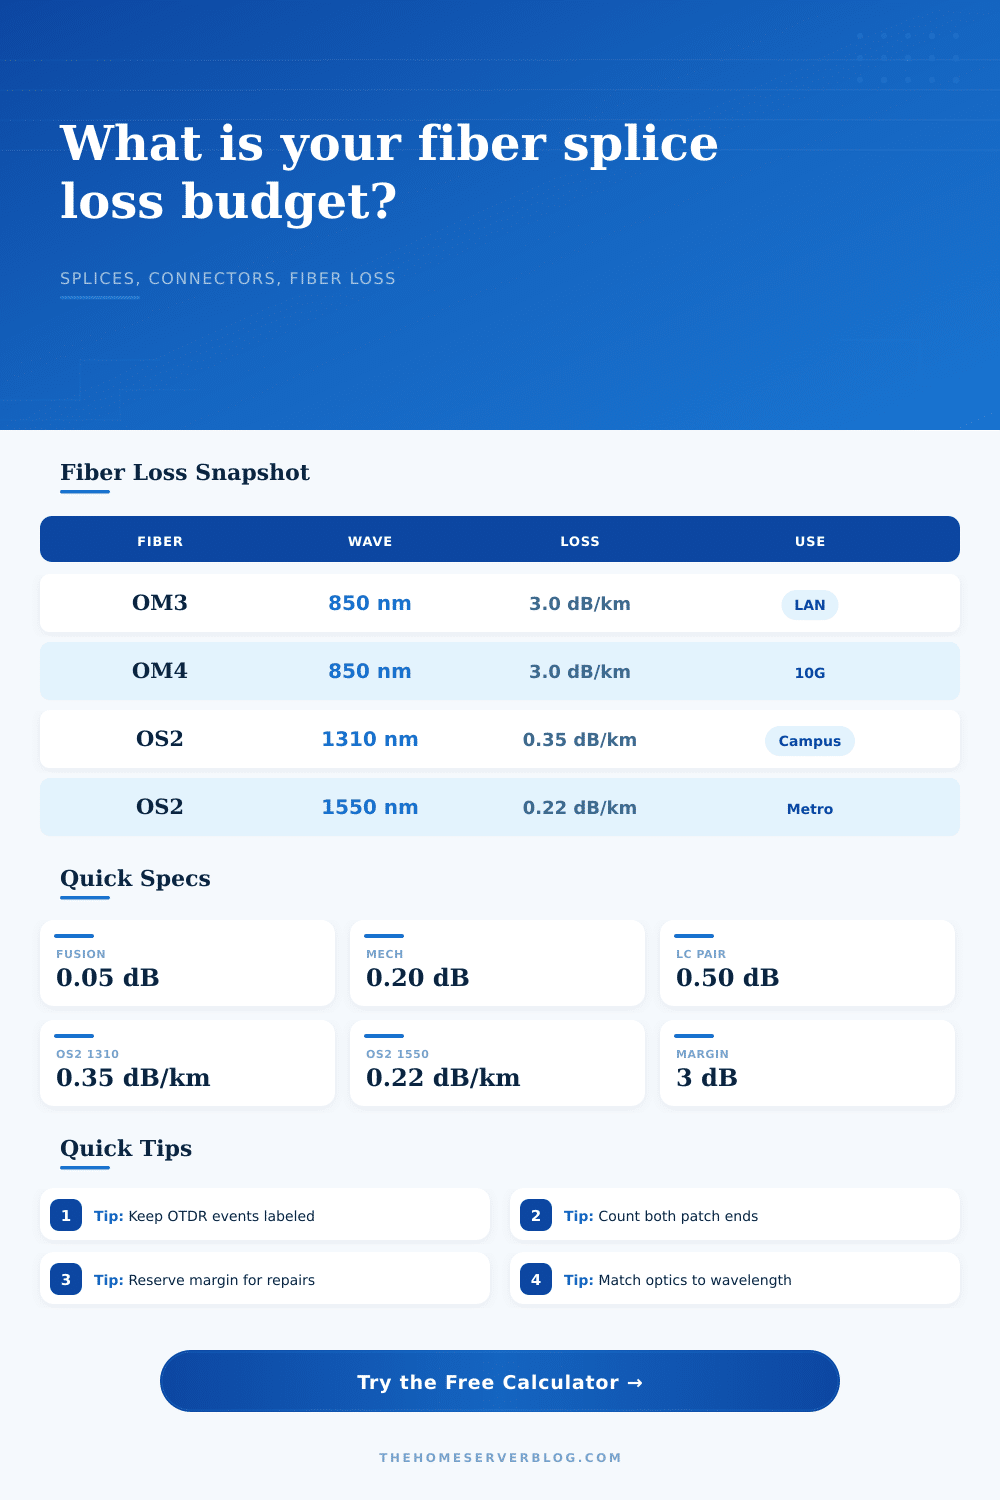
| Fiber type | Wavelength | Typical attenuation | Planning note |
|---|---|---|---|
| OM3 multimode | 850 nm | About 3.0 dB/km | Short 10G SR links; modal bandwidth often matters before raw loss. |
| OM4 multimode | 850 nm | About 3.0 dB/km | More bandwidth headroom than OM3 while using similar loss planning. |
| OS2 singlemode | 1310 nm | About 0.35 dB/km | Common campus and building backbone wavelength. |
| OS2 singlemode | 1550 nm | About 0.22 dB/km | Lower attenuation for longer paths, with receiver overload still checked. |
| Event type | Typical allowance | Formula term | Field clue |
|---|---|---|---|
| Fusion splice | 0.05 to 0.10 dB | fusion count x loss each | Low reflectance, stable when the protection sleeve is correct. |
| Mechanical splice | 0.20 to 0.50 dB | mechanical count x loss each | Useful for repair, but verify both insertion loss and reflectance. |
| LC or SC mated pair | 0.20 to 0.75 dB | connector pairs x loss each | Cleanliness and mating cycles can change the measured result. |
| Patch adapter or WDM | Use datasheet dB | extra event loss | Add passive filters, taps, and known OTDR event losses here. |
| Optic class | Typical wavelength | Planning budget | Common home lab use |
|---|---|---|---|
| 1000BASE-LX | 1310 nm | About 8 to 10 dB | Media converters, router uplinks, and small campus runs. |
| 10GBASE-SR | 850 nm | About 5 to 7 dB | Rack, room, and short building multimode links. |
| 10GBASE-LR | 1310 nm | About 6 to 8 dB | Singlemode building-to-building or long riser runs. |
| 10GBASE-ER | 1550 nm | About 14 to 15 dB | Longer outdoor or campus fiber where attenuation dominates. |
| Project pattern | Typical events | Primary risk | Calculator focus |
|---|---|---|---|
| Rack patch | 0 to 2 splices, 2 connector pairs | Dirty connectors on short optics | Receive power and connector allowance. |
| Home conduit run | 2 to 6 splices, 2 connector pairs | Unexpected repair splice or tight patch panel | Safety margin and splice mix. |
| Campus backbone | 8 to 24 splices, 4 connector pairs | Many closures consuming small dB amounts | Event-by-event insertion loss total. |
| Restoration link | Mixed fusion and mechanical splices | Temporary repair events becoming permanent | Mechanical mix and remaining headroom. |
Ah yes! One of my favorite problems as a network engineer: you pull a fiber link out of the rack, the link light remains dark. The cable’s okay; it’s physically connected. The transceiver is seated but the signal doesn’t make the jump.
Typically, it isn’t because there’s something wrong with the fiber; broken or otherwise. It’s because you underestimated the number of little losses that adds up to drown the signal.
How to Plan Your Fiber Link Budget
Why does this happen? Because you count the number of splices in the tray instead of planning your loss budget.
With fiber optics, it’s as if you’re walking down a long hall and the lights is getting fainter and fainter as you proceed. Each time you pass through a door, you steal a little more of illumination. The calculator does this math for you. But knowing what the variables mean helps make tool meaningful.
In particular, it divides total loss into separate components (connectors, splices) versus continuous losses (the fiber itself). Why? Because these behaves differently. Loss across the fiber gradually decreases amount of light; it scales with length. Connectors/splices are one-time penalties: You pay and can’t get your money back.
Mess these up and you’ll probably build a link that look good on paper but not so much in real world.
People tend to greatly underestimate connector loss. You can lose a few tenths of a decibel through a single mated pair. But plug that into four or five patch panels along the way and those fractions adds up in no time.
End face cleanliness is a big deal here. One tiny bit of dust on an LC connector can cause enough reflection to break the link entirely, it can also just trash the signal so that it’s unreliable when heavily loaded. It allows you to calibrate for connector condition. So you should of start thinking about real world maintenance (not ideal lab conditions).
Splices are another area where our intuition doesn’t always work well. Fusion splices has amazingly low loss. In short runs, they’re almost nil. If you’re running a long aerial span with dozens of splices though, those fractions does add up.
Mechanical splices are different, on the other hand. They are useful for quick repairs but they use up a significant portion of your power budget. If you run too many mechanical splices in one link, it will eat up your margin and the receiver won’t be able to pick up signal due to its lack of sensitivity. It is a tradeoff between optical performance and speed of deployment.
Perhaps most critical of all settings is the safety margin. This represents your cushion for temperature fluctuations, aging, and replacement parts. Without a margin, even small deterioration will result in an operable link becoming a failed link. The usual safety margin is set at 3 dBs. More are appropriate on long links and in harsher environments. Better to have excess than not enough.
The key number in the results is the estimated recieve power. Is it within spitting distance of the receiver’s sensitivity? That’s a fragile link. How about outside its ability to barely detect anything? Then you have some breathing room. It is your safety net.
Before you even put one strand of fiber in the ground, you’ll know exactly how much signal strength you have left and the calculator tells you exactly where you stand.
Fiber links are about loss, not raw speed. Each dirty connector, each splice, each bend eats away at your signal. You want to have as much light hitting the other side as possible. If you know what’s causing loss, you don’t need to guess anymore. You can design.
It’s all about the dark link light; it’s just a symptom of poor budgeting. A little foresight goes a long way.