Gzip Compression Ratio Calculator
Compare measured original and compressed payloads, then score savings, traffic reduction, efficiency, and target ratio gap from your real before and after bytes.
⚡Measured Analysis Presets
📏Before And After Payload Inputs
🧮Compression Analysis Grid
📚Reference Tables
| Content Type | Typical Ratio | Efficiency Clue | Analysis Note |
|---|---|---|---|
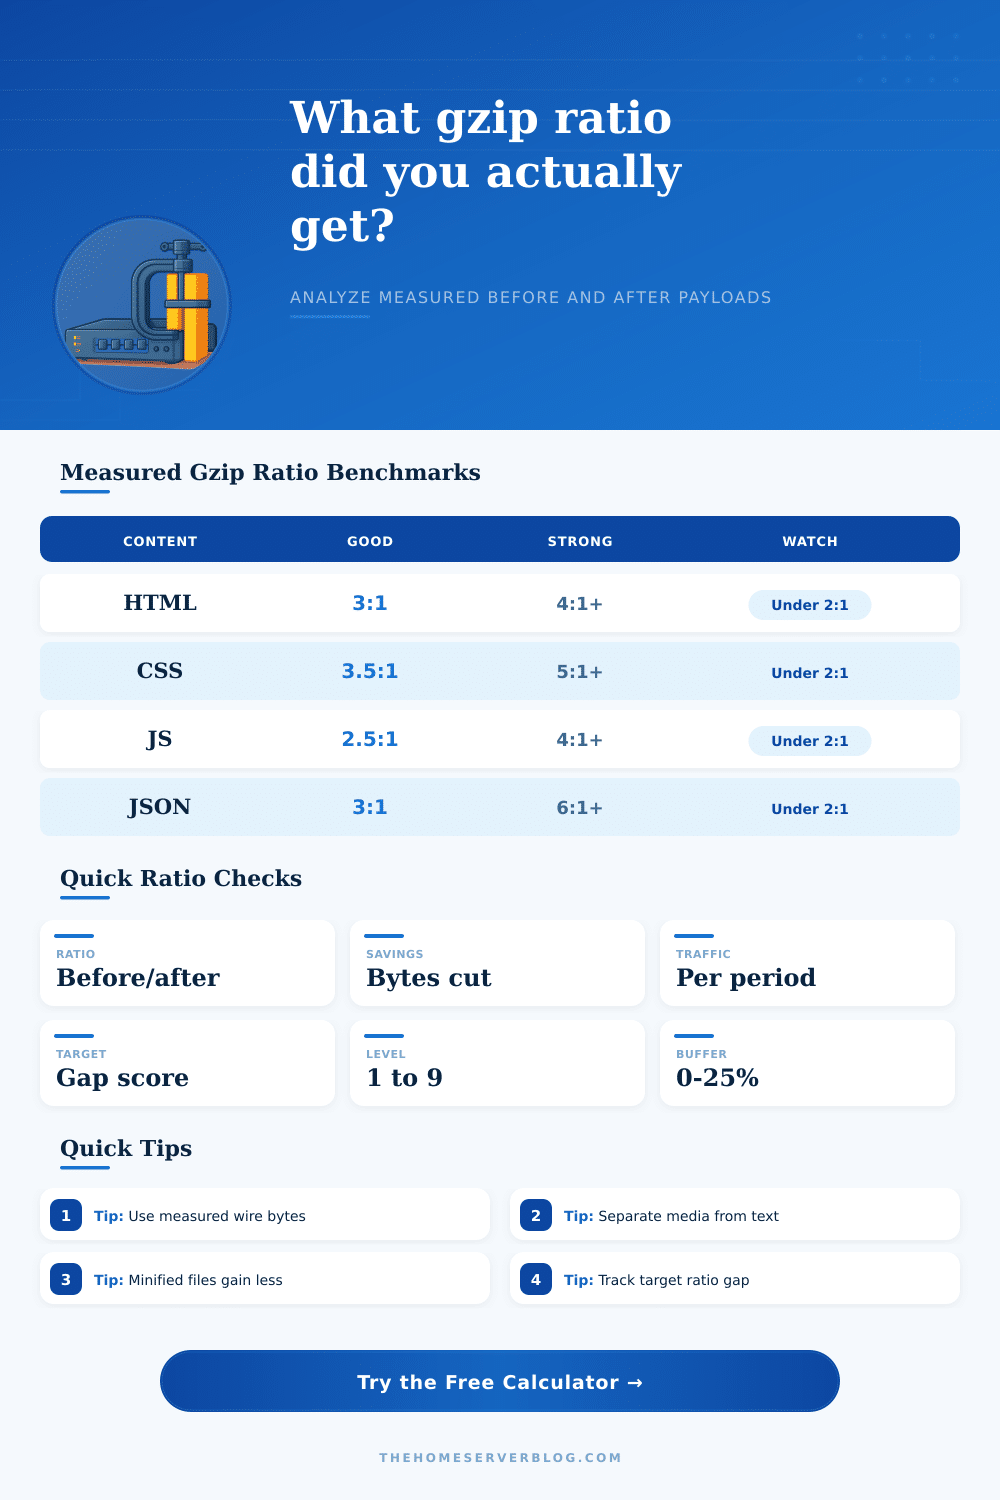
| HTML templates | 3:1 to 5:1 | Repeated tags and classes | Usually improves when shared layout is verbose. |
| CSS files | 3.5:1 to 6:1 | Repeated selectors and properties | Minified CSS still compresses well when selectors repeat. |
| JavaScript bundles | 2:1 to 4:1 | Identifier reuse and library patterns | Already minified bundles often show smaller marginal wins. |
| JSON API responses | 3:1 to 8:1 | Repeated keys and structures | Large arrays and repeated field names can score very high. |
| Logs and CSV exports | 5:1 to 12:1 | Predictable columns and tokens | Excellent ratio is normal when records share structure. |
| Images, video, archives | 1:1 to 1.1:1 | Already compressed binary data | Ratio near 1:1 is expected, not a gzip configuration failure. |
⚙Gzip Level And Spec Grid
| Level | Compression Bias | CPU Cost | Best Ratio Use |
|---|---|---|---|
| 1 | Fastest output | Lowest | Dynamic pages where latency matters more than maximum ratio. |
| 3 to 4 | Fast balanced | Low | Busy APIs, logs, and frequently regenerated payloads. |
| 5 to 6 | Default balance | Moderate | Most web servers and CDN gzip profiles for text assets. |
| 7 to 8 | Higher ratio | High | Reusable cached assets where build time or edge CPU is acceptable. |
| 9 | Maximum search | Highest | Static artifacts, reports, and files compressed once and served often. |
| 32 KB window | Deflate limit | Data dependent | Repetition outside the window may not improve the measured ratio. |
📌Target Gap And Mix Weighting Guide
| Measured Signal | What It Means | Good Follow-up | Ratio Impact |
|---|---|---|---|
| Actual ratio beats target | Compression is already meeting the planning goal. | Confirm bytes are measured after headers and transfer encoding. | Positive target gap |
| Actual ratio below mix expectation | Payload may contain binary chunks, short files, or precompressed data. | Split content types and test representative larger samples. | Efficiency score falls |
| High minified percentage | Whitespace and identifier savings were already captured. | Compare Brotli for static CSS and JS if supported. | Expected ratio lowers |
| High repetition score | Repeated keys, records, selectors, or markup should compress strongly. | Look for cache, dictionary, or chunking issues if ratio is weak. | Expected ratio rises |
| Large request volume | Small per-request savings may become meaningful transfer reduction. | Use the buffered transfer figure for capacity planning. | Traffic savings scale |
💡Practical Ratio Tips
Enabling gzip for your website is saving bandwidth, right? Sure, it’s true. But how much does it save? And more importantly, what kind is that saving?
Compressing something that’s already been minified is usualy a waste of CPU cycles and offers diminishing returns. Sure, a 3:1 compression rate for HTML (raw) sounds great, but if your payload contains mostly JavaScript then don’t expect to see anything like that number.
The Real Savings from Website Compression
Use this tool to help you distinguish between vanity metrics and real-world network efficiency; based off your own payload mix instead of some generic industry average. If you’re guessing that your HTML will compress at a 3:1 ratio, you’ll probably be surprised when you see if the actual content inside those tags matches that expectation.
So the first point to know: not all bytes is equal. Compression algorithms love repetitive patterns. They find these pattern in plain text. Unminified XML feeds or JSON response are full of repetitions. And if your API spits out thousands of record with matching key names, you’ll be able to use this fact aggressively as gzip spots these patterns and exploits them hard. This could easily lead to ratios in the range of six-to-one (or even higher) without doing anything special. That’s an easy win.
Then things get tricky once you mix up content types. Serving a page that embed heavy JavaScript bundles along with CSS files and some HTML structure results in a blended ratio. This ratio conceals performance of each single file. A mixed payload isn’t text you should treat like a text document, but neither does it meet the expectations of binary data.
That’s where the content mix weighting comes into play on this calculator. It forces you to consider that your 5 percent of media/binary asset will drag your overall ratio way down. Since binaries are already compressed, they doesn’t compress any further. Gzip doesn’t touch images, video and archived files, which skews the overall picture by leaving them exactly as they is. That’s not a config fail, it’s physics. Measure against that expectation and you’ll freak out about your healthy ratios on a mixed site.
Separate your media from your text when measuring. This clears the noise so you can tell if your text is working the way it should of.
There’s another tradeoff here which few teams account for until their server CPU hit the red when there’s a sudden surge in traffic: different compression levels. The fastest is level 1. It leaves money on the table because it don’t do any complex pattern searching. Level 9 squeezes out every last bit of redundancy, but it take longer. If you’re generating your page dynamically (on the fly), you’ll add latency by waiting until it’s fully compressed… and users will notice more then they appreciate how much smaller it made the kilobytes.
Level six is usually the sweet spot for most text asset, balancing speed against size reduction. Only go up further if you’re compressing your static files once at build time, then serving them again and again from cache.
People also measure the incorrect boundary too much. For example, when comparing filesystem size vs. When comparing wire transfer size, you introduce variables like TCP overhead, HTTP headers, and chunked encoding. These is unrelated to gzip’s efficiency. What you want to compare is original body bytes vs. Compressed body bytes. Numbers pulled from different sources (e.g., server logs on one side vs. Developer tool network tab on the other) make the ratio meaningless noise. Instead, the calculator focus on before-and-after payload sizes. These are normalized so you can set a target gap based on your specific infrastructure requirements instead of some theoretical ideal.
So: Sure, higher compression ratios is great, but they’re not the end game here. What you really want to do is keep transfer times down without bogging down the servers. So if you can get a good saving percentage with minimal CPU cost, then you win. Generally obsessing about getting another half percent out of that already-minified file isn’t worth the processor time or engineering effort. Go after the big tickets: verbose templates, repeated API structure, etc. Let the rest ride. Know what’s in your bytes so you don’t waste time chasing phantom savings. This way, you optimize for actualy performance.