LTE EARFCN Frequency Calculator
Convert LTE EARFCN values into downlink or uplink carrier frequency, check the band range, estimate duplex pairing, review guard-band clearance, and size a simple carrier aggregation span.
LTE frequency result
| Band | Duplex | DL EARFCN | DL frequency | UL EARFCN | UL frequency |
|---|---|---|---|---|---|
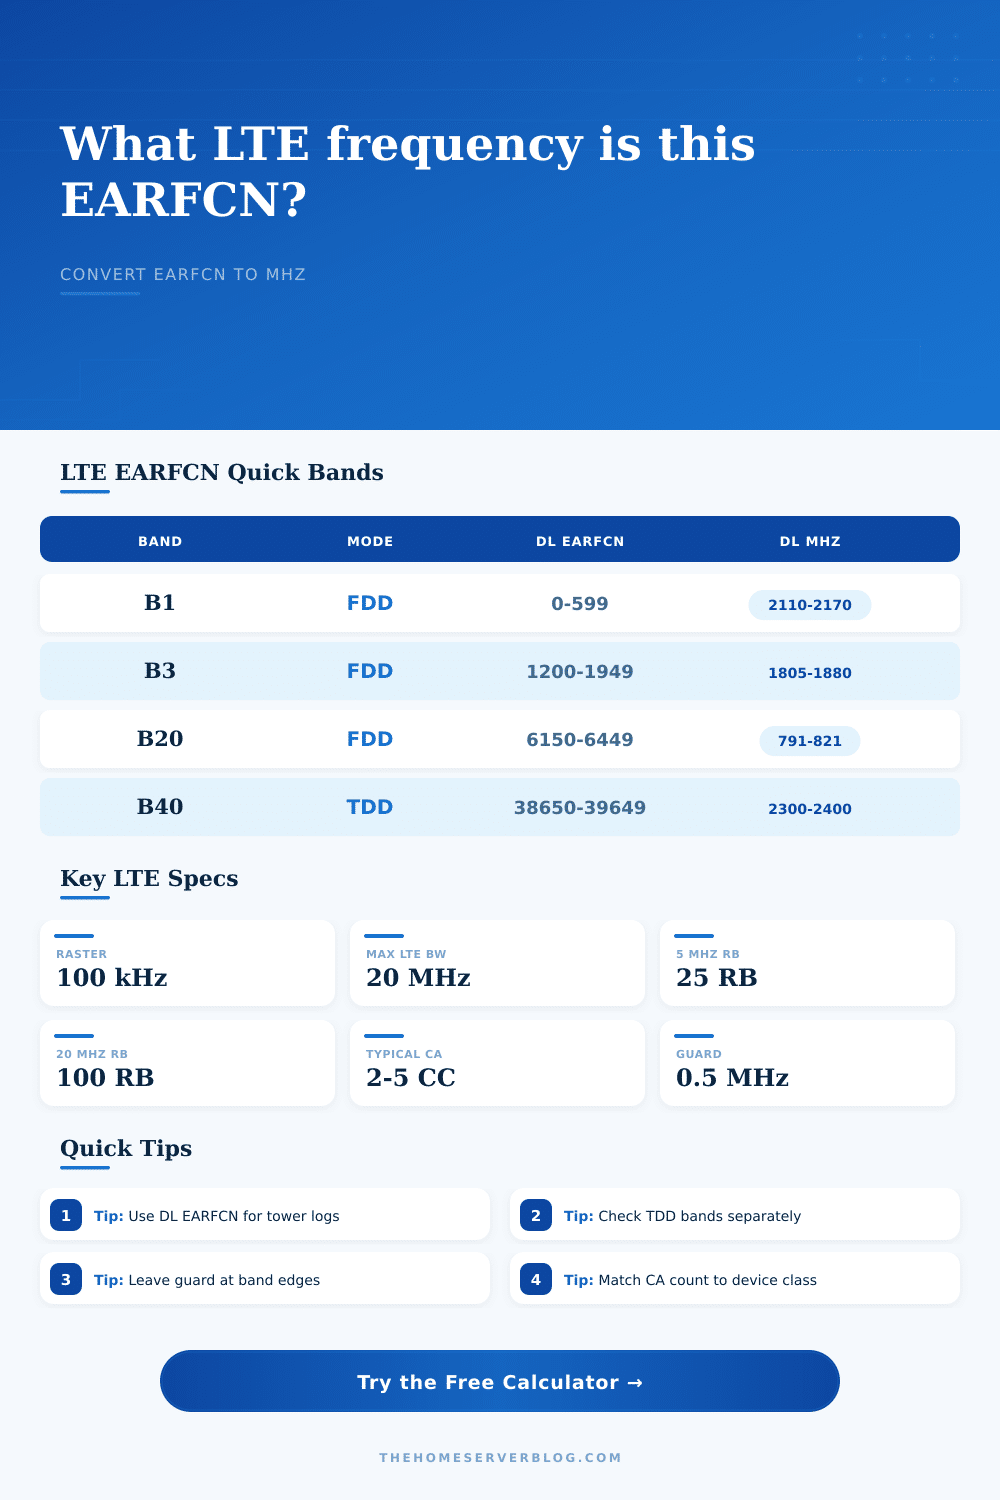
| B1 | FDD | 0-599 | 2110-2170 MHz | 18000-18599 | 1920-1980 MHz |
| B2 | FDD | 600-1199 | 1930-1990 MHz | 18600-19199 | 1850-1910 MHz |
| B3 | FDD | 1200-1949 | 1805-1880 MHz | 19200-19949 | 1710-1785 MHz |
| B4 | FDD | 1950-2399 | 2110-2155 MHz | 19950-20399 | 1710-1755 MHz |
| Band | Region fit | DL EARFCN | DL frequency | UL EARFCN | Duplex note |
|---|---|---|---|---|---|
| B5 | Americas, Asia | 2400-2649 | 869-894 MHz | 20400-20649 | 45 MHz spacing |
| B12 | Americas | 5010-5179 | 729-746 MHz | 23010-23179 | 30 MHz spacing |
| B13 | Americas | 5180-5279 | 746-756 MHz | 23180-23279 | Reverse pair |
| B28 | APAC, LATAM | 9210-9659 | 758-803 MHz | 27210-27659 | 55 MHz spacing |
| Band | Duplex | Shared EARFCN | Frequency range | Planning use | Pairing |
|---|---|---|---|---|---|
| B38 | TDD | 37750-38249 | 2570-2620 MHz | Capacity layer | Same carrier |
| B40 | TDD | 38650-39649 | 2300-2400 MHz | Urban capacity | Same carrier |
| B41 | TDD | 39650-41589 | 2496-2690 MHz | Wide TDD block | Same carrier |
| B7 | FDD | 2750-3449 | 2620-2690 MHz | High capacity | 120 MHz spacing |
| LTE bandwidth | Resource blocks | Nominal occupied RB width | Typical guard each side | CA example | Use case |
|---|---|---|---|---|---|
| 1.4 MHz | 6 RB | 1.08 MHz | 0.16 MHz | Rare CA | Narrow refarm |
| 5 MHz | 25 RB | 4.5 MHz | 0.25 MHz | 2CC = 10 MHz | Coverage LTE |
| 10 MHz | 50 RB | 9.0 MHz | 0.5 MHz | 3CC = 30 MHz | Common anchor |
| 20 MHz | 100 RB | 18.0 MHz | 1.0 MHz | 5CC = 100 MHz | Capacity LTE |
In a packed stadium, your phone might display a full set of signal bars. Yet data crawls. Why? Because you’re connected to network, yes, but it’s straining.
Enter: the LTE EARFCN frequency calculator. A spreadsheet, perhaps? Nope. It reveals exactaly what slice of spectrum your device is pulling from, and knowing which slice can explain why it surges (or stalls).
Why Use an LTE EARFCN Calculator?
Then there’s the math. This thing translate raw channel numbers to an actual frequency in megahertz. What do those frequency range mean for capacity? And how about for coverage?
It is Band 12. It is Band 20. These are low-band frequencies. They’re good because they punch through concrete and have that ability to wrap around buildings. If you’re in a skyscraper or out in a rural area, these channels will keeps you connected. But it’s like riding down a single lane, there isn’t much capacity.
It is Band 1. It is Band 7. These are high-band frequencies. It’s like a highway. Massive amounts of data pass over these bands, but turn a corner and the signal plummets. So if you know which band you’re on, then you’ll know if your connection is optimized for either speed or range.
These are uplink versus downlink channel. Most people overlook the difference between uplink and downlink frequencies. With Frequency Division Duplexing systems, the tower will listen on one frequency while your phone talks on another. The calculator break them out into separate channels. That way, you can verify exact amount of space between them.
That comes into play when you’re trying to troubleshoot interference. You might have a clean downlink, but not be able to upload. The problem could be in the uplink channel. That is where all user in the cell are broadcasting at once. Often, it’s a lot more congested. The tool switches between modes so you can see each side of conversation clearly.
So a 20 MHz channel may sound large but it’s filled with narrow guard bands to keep other carrier channels from bleeding over. Those guard bands is accounted for when calculating the occupied bandwidth, along with safety margins.
If you are wondering what Carrier Aggregation does, it enable networks to combine several chunks into one large band. So if they’re using five component carriers, your handset is gluing together a bunch of spectrum to make fast pipe. This explains why phones on the same tower sometimes have fast speeds while others struggles to crawl.
Duplex mode and region mapping are in the reference table. You can see that some bands has the same downlink and uplink frequencies (TDD). Band 40 is an example of this, and it makes interference a little tricky. They switch rapid between sending and receiving.
And when you feed an EARFCN into the tool, then you’re finding where your phone sits on this global grid of radio resources. It might be a supplemental capacity layer or, more importantly, an anchor carrier that act as a stable point of connection.
Failing to plan for the raster step is a common error. Don’t think of LTE as some sort of analog wave that gradually sweeps across the spectrum. It’s not. Instead, it exists only at specific points within the spectrum, separated from one another by 100 kHz intervals. The idea that there is a continuous signal is false, so computing where the middle lies can lead to error. The calculator forces separate stepping, ensuring your planning matches up with real world of radio hardware.
Likewise, it warns if you choose a channel width that extends past the licensed band edge, which is an absolute no-go. There’s no way around it; regulators have set limits that you must respect, and those guard bands are untouchable.
The tool fills in the blanks between abstract network logs and how radio waves actualy behave in the physical world. A bunch of gobbledygook becomes something understandable: “It’s this frequency, with this much bandwidth.”
Whether it’s setting up a tiny cell or figuring out why your dead zone exists, knowing which frequencies you’re working with is the beginning. Can’t see it? Won’t be able to fix it. Know the band? Check the channel. Understand the chunk of frequencies you’re operating within. Find the window, find the signal.