Maximum Spanning Tree Calculator
Rank candidate links from strongest to weakest, run descending Kruskal selection, and find the maximum tree weight, bottleneck capacity, skipped low-value links, and redundancy left outside the tree.
Capacity graph presets
Graph inputs
Maximum spanning tree result
Selection breakdown
Graph health cards
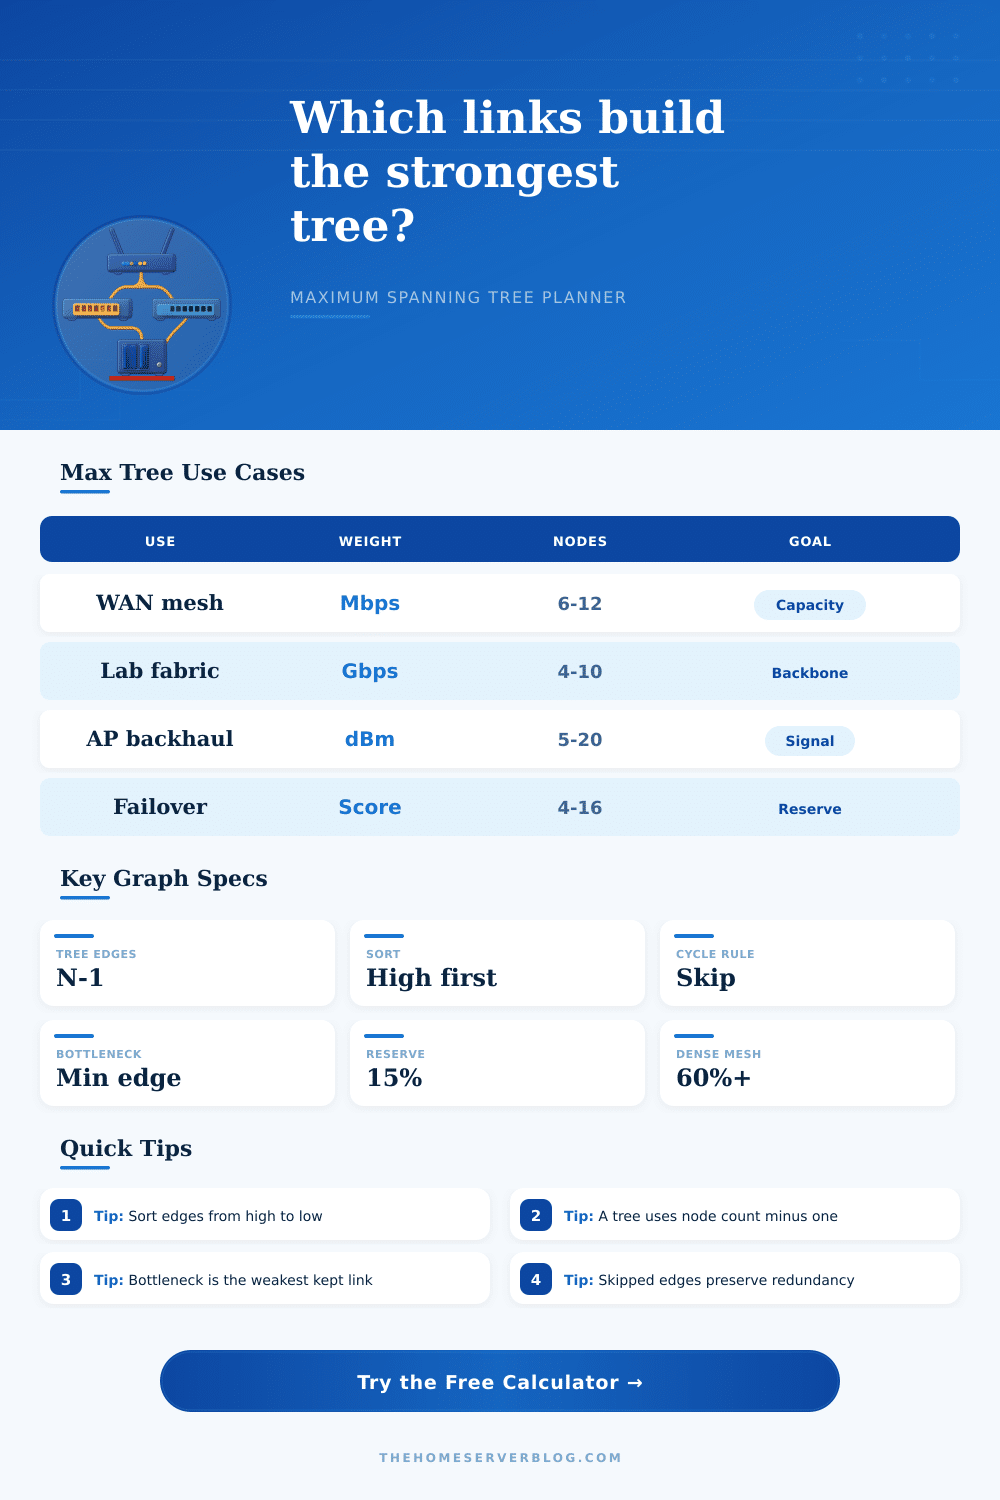
A connected graph with N nodes needs exactly N minus 1 selected edges in the final spanning tree.
Maximum spanning tree selection tries the strongest edge first, then skips edges that create cycles.
The tree capacity is often constrained by the lowest-capacity selected edge, not the total score.
Cycle-forming links are outside the tree but still matter for failover, maintenance, and alternate paths.
Descending edge selection
| Step | Edge | Capacity | Score | Decision |
|---|---|---|---|---|
| Run the calculator to see selected edges. | ||||
The list is sorted by the selected weight mode. Accepted links join two previously separate components; skipped links would create a cycle or fail thresholds.
Excluded low-value and cycle links
| Edge | Capacity | Reliability | Score | Why excluded |
|---|---|---|---|---|
| Run the calculator to see excluded edges. | ||||
Graph density reference
| Graph type | Edge density | Redundancy score | Planning meaning |
|---|---|---|---|
| Minimal tree | N - 1 edges | 0% to 20% | No real alternate path; maintenance can disconnect nodes. |
| Light mesh | 20% to 40% | 20% to 45% | Some failover links exist, but the best tree still carries most value. |
| Healthy mesh | 40% to 65% | 45% to 75% | Good home lab shape for access, AP backhaul, or site failover. |
| Dense mesh | 65%+ | 75%+ | Strong alternate routes; watch complexity and spanning-tree policy. |
Maximum spanning use-case grid
| Use case | Best weight mode | Typical bottleneck | What to do with skipped links |
|---|---|---|---|
| Switch uplink planning | Capacity only | Smallest selected trunk | Keep skipped trunks as maintenance or failover paths. |
| Wireless bridge mesh | Balanced capacity score | Weak RF backhaul | Use cycle links for alternate paths after signal changes. |
| WAN site selection | Reliability weighted | Unstable provider link | Reserve skipped links for backup VPN or SD-WAN policy. |
| Storage fabric layout | Capacity with latency penalty | Slow or distant storage hop | Promote low-latency cycle links for heavy east-west flows. |
Planning tips
Capacity tip: A maximum spanning tree is best for choosing a strong backbone, not for proving every pair has maximum flow. After finding the tree, inspect the bottleneck link and decide whether that weakest selected edge is acceptable during peak traffic.
Redundancy tip: Edges skipped because they create cycles are not wasted. They are the links that can become backup paths, maintenance bypasses, or extra bandwidth under routing protocols that support equal-cost or policy-based forwarding.
So you should pick your routes: which connections will carry data? Not all of them should be in the main trunk, because not every link will be redundant; some are stable but fast and some is slow but reliable. Even after choosing, you will still have way too many to simplify into one structure that does not bottleneck things or loop back on itself.
That’s when idea of maximum spanning trees helps, when it go from an interesting theoretical exercise to something useful for engineers. In theory it’s easy; in practice it’s hard. Traditional algorithms will simply find the cheapest way to connect everything, but what you’re looking for are robust connections. They should be strong because this is a backbone, not lightweight bits and pieces.
How to Choose Good Network Connections
The algorithm does all the math for you. Each potential edge are sorted from best to worst. Then, it select edges one at a time until no edges meet your quality minimums, or until a new edge form a loop. That greedy, bottom-up approach guarantees that every edge in your resulting tree is as strong as possible subject to constraints on the structure.
Capacity isn’t always everything: When you see those numbers, pay attention to weight mode.” For example, a fiber line might provide ten gigabits per second… But add 20 milliseconds of latency based off bad routing or distance. Yet a direct copper run might have slightly better speed, but it might be far more susceptible to being down with fluctuating power.
Use a balanced score that takes into account both latency penalties and reliability, and you’ll get a truer view of what those links are capable of delivering under pressure. It shows not just how fast they move data on paper, but whether or not they’re getting there reliablly when the network’s busy.
Secondly, think about “bottleneck” link, that’s what’s going to be your slowest link, even if most others are screaming-fast. Any traffic going through that link get throttled by the one slow connection, regardless of how blazing-fast nine other links may be. The tool draws attention to that minimum so you can consciously make an informed decision. Maybe you’ll take a bit less overall throughput but know that none of the links falls below a usable minimum. That’s where folks get tripped up when they just look at aggregate totals. Total bandwidth doesn’t do much good if your most critical path is strangled by a weak hop.
When thinking about redundancy, take care with the links that the algorithm bypassed. Just because those connections weren’t included doesn’t mean they’re bad. They’re often important for load balancing, maintenance windows, or in case primary path fails. A well-connected mesh will typically be somewhere between forty and sixty-five percent dense, meaning there’s sufficient alternate routing to handle failures while also not being so complicated as to make the entire thing unmanageable. Too few connections and you run into single points of failure; too many and you’ll experience management overhead and other convergence issues. By examining what edges were omitted and why, you can determine where the sweet spot lies.
To create this network isn’t about making all devices connect; it’s about which ones don’t connect. It isn’t about lowest cost, but about what carries most weight. That means thinking about what actualy performs well and stays up instead of just connected. That means weighing each edge to see if it should be in or out based on merits, not because you can get one. That leaves the dropped edges as backups and creates a solid core that can handle how people actualy move around. Then you build something solid enough so you don’t need to care about it anymore.