HomeServerBlog Wi-Fi mesh planning tool
Mesh Backhaul Hop Calculator
Estimate usable throughput after mesh hops, added forwarding latency, channel airtime pressure, and root AP uplink load from PHY rate, hop count, radio design, dedicated backhaul, client demand, channel width, mesh efficiency, and uplink capacity.
1Mesh presets
2Backhaul and load inputs
Calculation breakdown
Mesh health
3Topology comparison grid
4Backhaul reference cards
A same-radio repeater commonly loses about half of usable airtime per retransmitted hop.
Controller-managed mesh, WPA overhead, steering, and retries often land in this range.
Above this pressure, latency and retries usually rise faster than throughput.
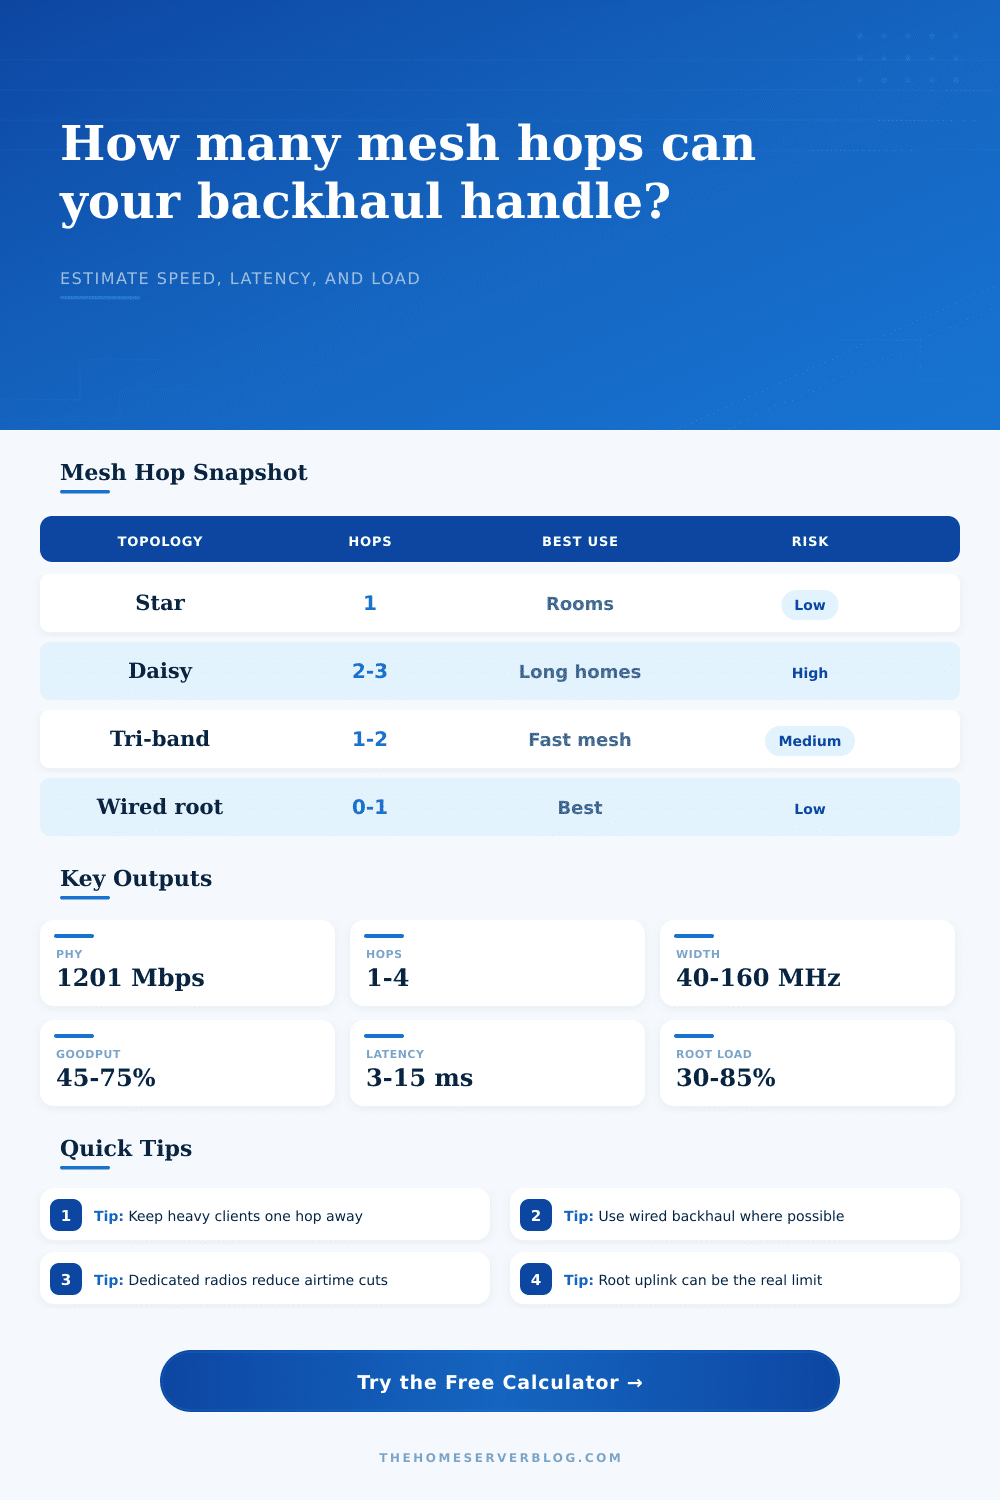
Most wireless mesh homes should keep high-demand rooms within one or two wireless hops.
5Mesh reference tables
| Radio profile | Repeat behavior | Latency per hop | Planning note |
|---|---|---|---|
| Dual-band Wi-Fi 5 shared | High same-channel repeat loss | 3.5 ms | Works for browsing and IoT, but avoid long chains for NAS or gaming. |
| Dual-band Wi-Fi 6 shared | Better OFDMA scheduling, still shared | 2.8 ms | Good mainstream mesh baseline for one-hop satellites. |
| Tri-band Wi-Fi 6/6E | Dedicated radio can preserve client airtime | 2.1 ms | Best wireless option when Ethernet backhaul is unavailable. |
| Wi-Fi 7 MLO capable | Multi-link scheduling can smooth bursts | 1.6 ms | Plan conservatively unless both nodes support the same MLO mode. |
| Outdoor directional 5 GHz | Stable when aligned and clear | 2.4 ms | Useful for detached offices, sheds, and yard cameras. |
| 60 GHz short-range link | Very fast, line-of-sight sensitive | 1.2 ms | Great for short clean paths, weak through walls and foliage. |
| Channel width | Typical role | Interference risk | Mesh planning use |
|---|---|---|---|
| 20 MHz | Longer reach and crowded bands | Low | Reliable for IoT and low-rate remote nodes. |
| 40 MHz | Balanced outdoor or 2-hop mesh | Low to medium | Often more stable than 80 MHz in busy neighborhoods. |
| 80 MHz | Mainstream high-throughput home mesh | Medium | Good default for Wi-Fi 5/6 backhaul with clean 5 GHz spectrum. |
| 160 MHz | Fast 5/6 GHz backhaul | Medium to high | Works best on 6 GHz or clean DFS channels. |
| 320 MHz | Wi-Fi 7 short-range peak rate | High | Use for clean 6 GHz rooms, not long multi-hop chains. |
| Hop count | Shared-radio expectation | Dedicated-radio expectation | Recommended traffic |
|---|---|---|---|
| 0 hops | Root AP only | Root AP only | NAS, gaming, video calls, and wired clients. |
| 1 hop | Often 45-60% of usable PHY | Often 60-75% of usable PHY | General clients, 4K streaming, home office desks. |
| 2 hops | Often 25-40% of usable PHY | Often 45-65% of usable PHY | Moderate devices, cameras, light workstations. |
| 3+ hops | Latency and airtime climb quickly | Still needs careful load control | Low-rate devices unless link quality is excellent. |
| Root uplink | Remote load example | Root pressure | Practical interpretation |
|---|---|---|---|
| 500 Mbps | 200 Mbps remote node | 40% | Fine for a small satellite, but multiple nodes may saturate it. |
| 1 Gbps | 350 Mbps remote node | 35% | Common home-lab baseline for one or two mesh satellites. |
| 2.5 Gbps | 800 Mbps remote node | 32% | Good match for tri-band Wi-Fi 6E or Wi-Fi 7 backhaul. |
| 10 Gbps | 1.8 Gbps remote node | 18% | Root uplink is unlikely to be the first bottleneck. |
6Mesh planning tips
You just installed a brand-new Wi-Fi 6E system and fire up a speed test from your livig room. Gigabit connection achieved! Dashboard says perfect.
So you head to your home office and your video call goes down.
Why Your Wi-Fi Gets Slow With Mesh Networks
This isn’t usually the router’s fault. It’s the invisible route that your data travels. Every wireless hop add latency and eats through throughput. A wireless mesh network promises complete coverage, but every hop come at a cost.
Understand this before you buy or you could end up with a seamless network or barely any network at all. Wireless repeaters can only be half of the solution. Radio waves are inherently half-duplex; they can’t do both receive and transmit simultaniously.
So when a dual-band mesh node hear something from the root access point, it has to switch off its listen mode, turn 180 degrees and retransmit information to your device. That means it’s halving the usable airtime every hop and the math sucks.
You can use this page’s calculator to model that penalty in advance, before your Wi-Fi dead spots arrives.
Good” means you have lots of bars showing on your phone, right? Not exactly. Even though a node may show five bars to the root, if it’s sharing single radio for backhaul forwarding as well as client traffic, it’s got very little bandwidth remaining to handle real devices.
To account for this, the tool lets you toggle between shared and dedicated backhaul radios, tri-band systems provides an additional lane for backhaul traffic, leaving client airtime intact. This explains why choosing a dual-band system with several hops cause such a large drop in the throughput estimate. It also adds latency, which degrades performance.
Because every packet that traverses a node incur some queuing time plus processing delay, each hop add milliseconds. A couple more milliseconds won’t make much difference if you’re surfing the web. But for real-time collaboration or gaming, it does.
Adding even a single hop to your path (in a mixed dual-band scenario) can tack on almost three milliseconds, according to the reference tables provided with the calculator. Double that number by adding two hops. And increase congestion by having a heavily loaded root access point working at the other end of your WAN link.
You’re not only battling distance, but also the network’s scheduling capabilities. It turns out that this is where channel width matter.
Yes, wider channels mean potentially faster raw speeds. But they’re also more likely to pick up your neighbors’ noise and start forcing retries that ruin your actual experience.
So while an 80 MHz channel may appear to be quicker on paper, great! It could suffer from retries due to noise from nearby channels in an apartment environment, for example, which will cripple actual throughput.
The calculator allows you to toggle channel width to understand the tradeoff between raw capacity vs. Potential for interference. Often narrower channels actualy yield better stable performance in denser environments, though the peak numbers may look smaller as a result.
Installers miss the root access point load until it is too late. Eventually all of this traffic flow back into the main gateway (called a “root” node). You may be able to support 300-megabit-per-second connections from each remote node, but your root uplink maxes out at one gigabit; that leaves space for only two or three of those before the entire system gags.
When it does, the tool tells you how loaded your root is by percentage. It would of been useless to have a lightning-fast last mile if the road entrance is clogged.
For the same reason, the best mesh network designs aren’t about power; they’re about where you put stuff. A weaker but closer link will nearly always beat a strong-looking one that has to hop through two wireless relays. Not only do you have fewer devices chewing up airtime, but you are also keeping your data on a short leash.
That’s what the calculator’s presets demonstrate, pitting a node in one room against a daisy-chain down the hall. In most cases, the former configuration looks like it can handle less, but beats out the more complex setup hands down.
Keep in mind that these numbers is an estimate, not a promise. No software ever captures all possible variables in your real world, such as walls, microwave ovens, and other neighboring networks. But it does provide a concrete baseline for understanding how uplink capacity, radio type, and hop count work together.
Instead of running around chasing signal strength, now you’re chasing real performance. You don’t just want full bars; you want to feel like you have a fast network wherever you go.