MTBF Calculator
Estimate home server mean time between failures, annualized failure exposure, service availability, and downtime impact across hosts, storage, power, cooling, and network redundancy.
⚙Home Lab Reliability Presets
🔧Reliability Inputs
MTBF is reported from annualized failure intensity, then converted to the selected display scale.
The model converts AFR to failure intensity, applies environment adjustment, estimates k-of-n redundancy exposure with repair time, then reports availability and downtime for the whole service path.
Reliability Breakdown
Enter system details🖧Equipment Spec Grid
📊Component AFR Reference
| Component group | Typical AFR input | What changes the estimate | Home server note |
|---|---|---|---|
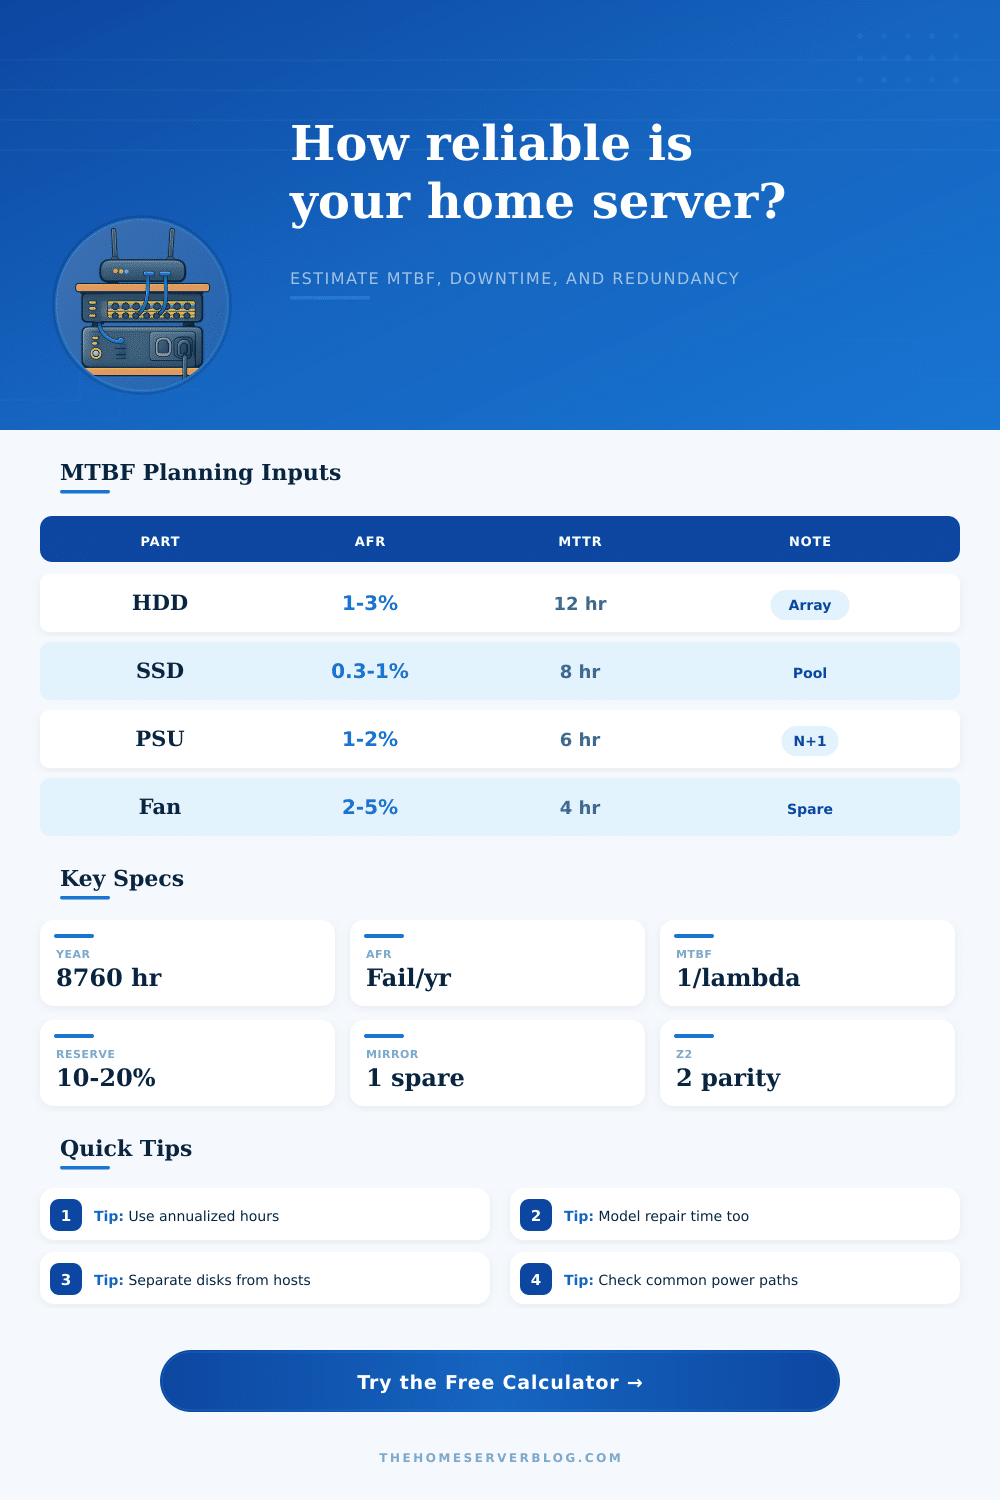
| NAS HDD in mixed home use | 1.0% to 3.0% | Drive age, temperature, vibration, workload, and batch similarity | Large drive counts raise event rate even when each disk looks reliable |
| SATA or NVMe SSD | 0.3% to 1.2% | Write endurance, controller quality, heat, and power-loss behavior | Separate device failure from filesystem or pool design risk |
| Mini PC or server motherboard | 1.5% to 4.0% | Thermals, PSU quality, capacitor age, and firmware stability | Host-level failures often affect compute, storage, and networking together |
| Power supply or UPS-backed feed | 1.0% to 3.0% | Load percentage, heat, dust, fan health, and input power quality | Dual PSUs only help when upstream power paths are not identical weak points |
| Network interface, switch port, or cable path | 0.5% to 2.0% | Connector quality, PoE heat, switch age, and cable routing | Two links on one switch are redundant for cable failure, not switch failure |
| Cooling fan or fan tray | 2.0% to 6.0% | Dust loading, bearing type, temperature, and RPM profile | Fans may be noncritical in pairs but critical in dense rack chassis |
📐Availability Target Reference
| Availability target | Unplanned downtime per year | Where it usually fits | Calculator setting to watch |
|---|---|---|---|
| 99.0% | 87.6 hours | Hobby services, lab experiments, local-only tools | Repair time and single-host failures dominate |
| 99.5% | 43.8 hours | Family apps, media libraries, simple NAS access | Storage parity and backup restore process matter |
| 99.9% | 8.76 hours | Important remote access, DNS, sync, and home automation | Hosts, network paths, power, and repair time all matter |
| 99.95% | 4.38 hours | Always-on home office or remote family services | Common-cause risks can erase apparent redundancy |
| 99.99% | 52.6 minutes | Very high home lab target with tested failover | Planned maintenance and automation become visible |
🛡Redundancy Pattern Reference
| Pattern | Fault tolerance | Primary benefit | Hidden dependency |
|---|---|---|---|
| Single host, single PSU, single link | 0 spare paths | Simple failure math and easy maintenance | Every critical component is in the service path |
| Two hosts, one required | 1 host spare | Host failure can be absorbed if services can fail over | Shared storage, shared switch, and quorum design |
| Dual PSU or dual UPS feeds | 1 power spare | Power module replacement without stopping service | Both feeds may still depend on one wall circuit or UPS |
| Mirrored storage | 1 drive spare | Fast rebuild and simple degraded operation | Controller, HBA, and filesystem failures are separate |
| RAIDZ2 or RAID 6 | 2 drive spares | Better protection during long large-drive rebuilds | Bad backups and batch drive failures are outside parity |
| Dual network links to two switches | 1 path spare | NIC, cable, or switch maintenance without outage | Router, DNS, VLAN, and LACP configuration quality |
🧮Common Home Server Reliability Scenarios
| Project | Typical model | Most sensitive input | Practical interpretation |
|---|---|---|---|
| Single NAS appliance | One host, four drives, one parity spare | Drive AFR and repair time | Expect drive events before whole-host events in many pools |
| Router VM host | One host, one PSU, one network path | Host electronics AFR | A reliable backup router often improves real availability more than a faster server |
| Mini PC cluster | Three hosts with two required | Common-cause and quorum risk | Cluster math needs independent power and network design to pay off |
| Media server tower | One host, many disks, noncritical downtime | Storage event rate | MTBF may look lower because many disks create more component events |
| HA firewall pair | Two hosts, one required, redundant links | Shared switch and power path | Failover testing is part of the reliability model, not a separate chore |
| Rack core N+1 | Dual power, dual network, parity storage | Maintenance and repair window | Availability rises when repairs are fast and common-cause risk is controlled |
💡MTBF Planning Tips
Server owners often notice the reliability of there systems when something fail at an inconvenient time. A drive might fail on a Saturday night. Power might flicker during a storm.
The network link might fail when trying to remotely access the server. These types of failures cause people to begin to consider the question of how often failures are suppose to occur and whether there current server is built for their intended use case. The answer to these questions is depending upon how often failures are defined and how quick they can restore the service after those failures occur.
Using MTBF to Check Server Reliability
Mean Time Between Failures (MTBF) is a measurement that translates the failure rates of each of the components of a server into an estimate of how long the system is suppose to last before a failure occurs. The MTBF is not a promise of reliability of the system, nor is the MTBF a guarantee that the system will not fail. Instead, the MTBF is a statistical average of the system failures that is calculated based upon the failure rates of each of the system component and the redundancy that exists within the server setup.
The calculator that is provided to each of the readers of this article will transform each of these component failure rates and redundancy option into a set of numbers that can be compared from one server configuration to another. The inputs to the calculator are each an expression of the physical components of the server system. Factors like the number of host and the Annualized Failure Rate (AFR) of those hosts will determine the reliability of the system due to the failure of those computers.
The same is true for the drives and their AFR; the more drives that is installed into a server, the more drive failures that will have to be accounted for in the calculation of reliability. Likewise, factors like power supply, network paths, and cooling fans will contribute to the failure of the system. The parity of drives will impact how many drive failures the system can withstand before it become unavailable to users.
Finally, the time that is required to repair the system is another variable in the calculation; twelve hour to fix a server might not always be twelve hours of work, especially if components have to be ordered or if troubleshooting must occur first. In addition to the factor discussed above, there are other variables related to the environment in which the system is deployed. For instance, drives that are located on a dusty shelf in a warm closet will fail at a faster rate than drives that are located in a well-ventilated rack with clean air that is filtered before it reach the computers.
Additionally, it is possible for a group of otherwise independent computers to become a point of failure if they share power, switches, or some other maintenance procedure. Both of these variable are factored into the availability calculation to determine the reliability of the system within its actual area, instead of within an idealized laboratory environment. Another consideration to the availability of a server system is the availability target that is defined by the system administrator.
For instance, a target of 99.9% availability will allow for approximately nine hour of downtime per year for the servers; that downtime will have to account for the failure of all of the hosts, drives, power supplies, and network links. While planned maintenance is not counted in that nine-hour budget, the system will still be unavailable during those periods of planned maintenance. Thus, the availability calculation allows system administrator to separate these two type of downtime.
The type of redundancy that is built into a server system will only provide protection if the additional components are independent of the original components of the system. For instance, two power supplies only provide redundancy if they is drawn from separate circuits. The same is true for network links and switches.
Should all of the host in a server cluster share the same power supplies and network links, their clustering will not provide redundancy to the system. These considerations are included in the reference table for the system so that server owners understand in what ways redundancy in their server can fail due to these shared risk. Additionally, the repair time of the system interacts with the redundancy considerations of the system.
For instance, if a server feature a mirrored pair of drives, it is likely to survive the failure of one drive. However, the failure of the second drive will still occur according to the same AFR as that of the failed drive. If the time that is required to replace the failed drive takes many days instead of many hour, the redundancy in that drive will be outweighed by the additional risk of the failed drive being replaced.
The calculator for MTBF takes into account the Mean Time to Repair for each component failure, which can help server owners understand how changing the repair time will impact the availability of the system. The failure rates of each of the system components will have inherent variation. For instance, enterprise drives are of higher quality than desktop drives, but both types of drives can fail at the same average rate.
The failure rate of each drive can be adjusted in the calculation of availability to reflect the drives that the server owners actualy own. Each of the example systems that is presented on the page have different components, therefore they will feature different rate of failure and availability. For instance, a NAS system that features four drive and single parity settings will experience drive failures before it will experience host failures.
A host for a router VM will experience motherboard or power supply failures first. Finally, the three-node cluster will only gain redundancy if the power and network links of those nodes are also independent of each other. These example systems will have their own MTBF calculation, which will factor in all of the component of each system.
The most useful component of the available MTBF calculation is the ability to make change to one variable at a time. For instance, changing the repair time will alter the availability of the system. Adding another power supply path will reduce the impact of power supply failures on the availability of the system.
Increasing the common-cause failure will reduce the benefit of adding redundancy to the system. These comparisons can be made with the calculator for MTBF so that system owners dont have to perform these calculation themselves. Overall, this model is a planning tool.
It will tell system owners that certain components of a system carry more risk than others, and that some changes to the system will have a more notable impact upon availability than others. Thus, this model is useful before any purchase of new drives or any rewiring of the rack housing the server.