🖥️ N+1 Cluster Sizing Calculator
Calculate exactly how many nodes you need for high-availability clusters with N+1 (or N+2) redundancy
Max Util.
Max Util.
Max Util.
Max Util.
Max Util.
Max Util.
Max Util.
Max Util.
| Active Nodes (N) | N+1 Total Nodes | N+2 Total Nodes | N+1 Redundancy | N+2 Redundancy |
|---|---|---|---|---|
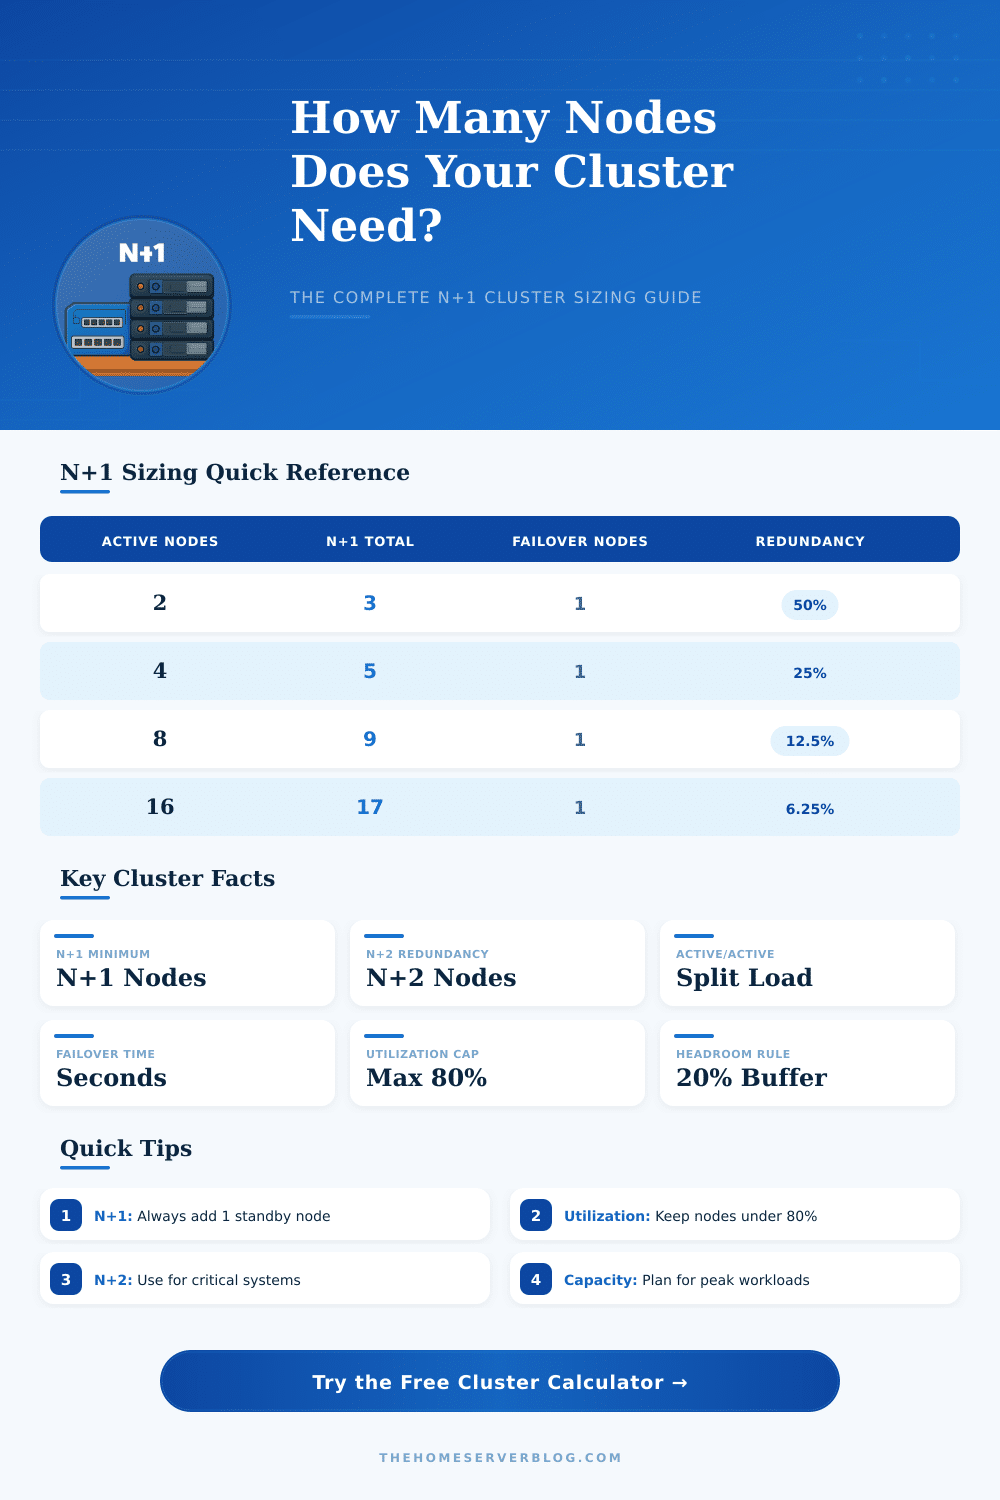
| 2 | 3 | 4 | 50.0% | 100.0% |
| 3 | 4 | 5 | 33.3% | 66.7% |
| 4 | 5 | 6 | 25.0% | 50.0% |
| 6 | 7 | 8 | 16.7% | 33.3% |
| 8 | 9 | 10 | 12.5% | 25.0% |
| 10 | 11 | 12 | 10.0% | 20.0% |
| 16 | 17 | 18 | 6.25% | 12.5% |
| 20 | 21 | 22 | 5.0% | 10.0% |
| 32 | 33 | 34 | 3.13% | 6.25% |
| 50 | 51 | 52 | 2.0% | 4.0% |
| Node Count | 16-Core Nodes (Total Cores) | 32-Core Nodes (Total Cores) | 64 GB RAM Nodes (Total RAM) | 128 GB RAM Nodes (Total RAM) |
|---|---|---|---|---|
| 3 | 48 cores | 96 cores | 192 GB | 384 GB |
| 5 | 80 cores | 160 cores | 320 GB | 640 GB |
| 7 | 112 cores | 224 cores | 448 GB | 896 GB |
| 9 | 144 cores | 288 cores | 576 GB | 1,152 GB |
| 11 | 176 cores | 352 cores | 704 GB | 1,408 GB |
| 17 | 272 cores | 544 cores | 1,088 GB | 2,176 GB |
| 21 | 336 cores | 672 cores | 1,344 GB | 2,688 GB |
| Total Nodes | Usable Nodes (N) | Max Safe Util. (80%) | Effective Capacity | Failover Impact |
|---|---|---|---|---|
| 3 | 2 | 80% | 160% of 1-node | 1 node absorbed |
| 5 | 4 | 80% | 320% of 1-node | 1 node absorbed |
| 9 | 8 | 80% | 640% of 1-node | 1 node absorbed |
| 11 | 10 | 80% | 800% of 1-node | 1 node absorbed |
| 17 | 16 | 80% | 1280% of 1-node | 1 node absorbed |
| 21 | 20 | 80% | 1600% of 1-node | 1 node absorbed |
And not all server failures are clear cut. What happens more frequent is that your servers silently stop responding but keep your monitoring dashboards green for 30 seconds before you notice the problem. Customers see error page and revenue is lost quietly. It’s enough to make cluster sizing feel more about managing anxiety than solving an engineering problem.
You want just enough redundancy to survive inevitable failures without wasting money on idle hardware. The source of this tension are the N+1 model. The promise is that your system will run at full capacity even when one component fail. Four active node? Add a fifth and you’ve got a buffer. One of those nodes dies? Three others handle load along with standby. Simple enough, right?
How to Size Your Server Cluster
It changes when you start factoring in utilization rates and growth projections. That’s where the calculator above come in. Input your hardware specs and it’ll crunch the numbers for you, no guessing whether or not you have sufficient headroom.
But most teams configure their clusters for an average day; and then get blindsided when user demand suddenly spike (or when peak traffic hit). That’s where the growth buffer input comes in. If you’re ignoring planned feature rollouts or organic traffic increases, a cluster might look balanced today but it’ll be overstressed within six months. Giving yourself a 20 percent cushion buys time to plan your next expansion without having to panic-buy on a holiday weekend.
It’s all about workload types. Some applications can absorbs more work with less stress while others need to throttle down as soon as they’re maxed out. For example, you could run your general application servers at eighty percent utilization and have them handle traffic gracefully. You couldn’t do that with a database node… It would either has to pause in the middle of queries (resulting in locked rows or inconsistent data) or accept the load.
Because of this, type of service will determine the maximum use target. Eighty percent may be fine for your general application servers but pushing your main database cluster that high mean you have no wiggle room when one of those nodes drops out. That’s why their effective capacity depend on redundancy level, see the reference table on the page.
Then there’s the matter of leftover node when you do fall over. The lost server’s load gets distributed across survivors. And if those servers are near their limit, they’ll either slow down or start throttling. Or they’ll fail too; a cascading effect that’s every infrastructure engineer’s nightmare. The lower you keep your baselines, the more slack each node have computationally and thermally to absorb extra load without failure.
N+1 is not the only flavor of redundancy. Moving up to an N+2 config gives you two levels of redundancy rather than one. However, it also doubles your overhead for idle hardware. In other words: it’s a pure cost-versus-risk-of-outage calculation. Do you want to spend money on two more redundant servers, just in case? Sure. If it’s a million dollars a minute and you’re down, the answer is yes. If you’re a small business, the answer is almost certainly no.
In short: A cluster size is a way of weighing efficiency against fear. How much do you want to be ready for the worst? And how much do you want to pay for that preparation daily? The inputs in the tool turn general risk into real hardware specs and node counts so you can see that trade off. That vague sense of insecurity becomes a data-driven plan.
Don’t design around averages; design around your peak load. Don’t design for one of everything; instead, design with redundancy and decide how much you want to keep sitting idle. And then design for that growth buffer so you’re never outgrowing your infrastructur while you wait for the next upgrade cycle.
It’s about staying online, yes! But it’s also about doing so without going broke or staying up at night worrying about every little alert. That’s what realy gives a system resiliency, making it robust rather than merely redundant.