Storage Growth Forecast Calculator
Forecast NAS, RAID, and ZFS pool runway from daily ingest, retention targets, snapshot churn, compression savings, drive layout, and practical free-space reserves.
The calculator reports decimal TB because drive labels and most NAS planning sheets use decimal capacity. Operating systems may display lower TiB values.
| Layout | Usable rule | Typical reserve | Best fit |
|---|---|---|---|
| Single disk or stripe | N disks, no parity | 10% | Scratch, replicated data, noncritical staging pools. |
| Mirror pairs / RAID 10 | About 50% raw | 15% | VMs, databases, small random IO, fast rebuild needs. |
| RAIDZ1 / RAID 5 | N-1 disks | 20% | Small pools where one-disk fault tolerance is acceptable. |
| RAIDZ2 / RAID 6 | N-2 disks | 20% | General NAS, media libraries, backup targets, 6-10 bay builds. |
| RAIDZ3 | N-3 disks | 20% | Large wide vdevs where rebuild exposure matters more than capacity. |
| Unraid dual parity | N-2 disks | 12% | Mixed disk sizes, media archives, slower write-heavy workloads. |
| Snapshot profile | History | Modeled churn | Use case |
|---|---|---|---|
| No snapshots | 0 days | 0% | Cold archive, disposable scratch, replicated target already protected elsewhere. |
| Short low churn | 14 days | 0.8% daily | Media shares, family documents, mostly append-only folders. |
| Normal NAS churn | 30 days | 1.5% daily | Shared files, backups, app data, documents, mixed household use. |
| Project churn | 60 days | 2.2% daily | Editing projects, working folders, active creative NAS datasets. |
| VM datastore churn | 30 days | 6.0% daily | Virtual disks, container volumes, package caches, test environments. |
| Deep protection | 90 days | 2.0% daily | Important shares with rollback needs and slower archive rotation. |
| Workload | Typical ingest | Compression | Planning note |
|---|---|---|---|
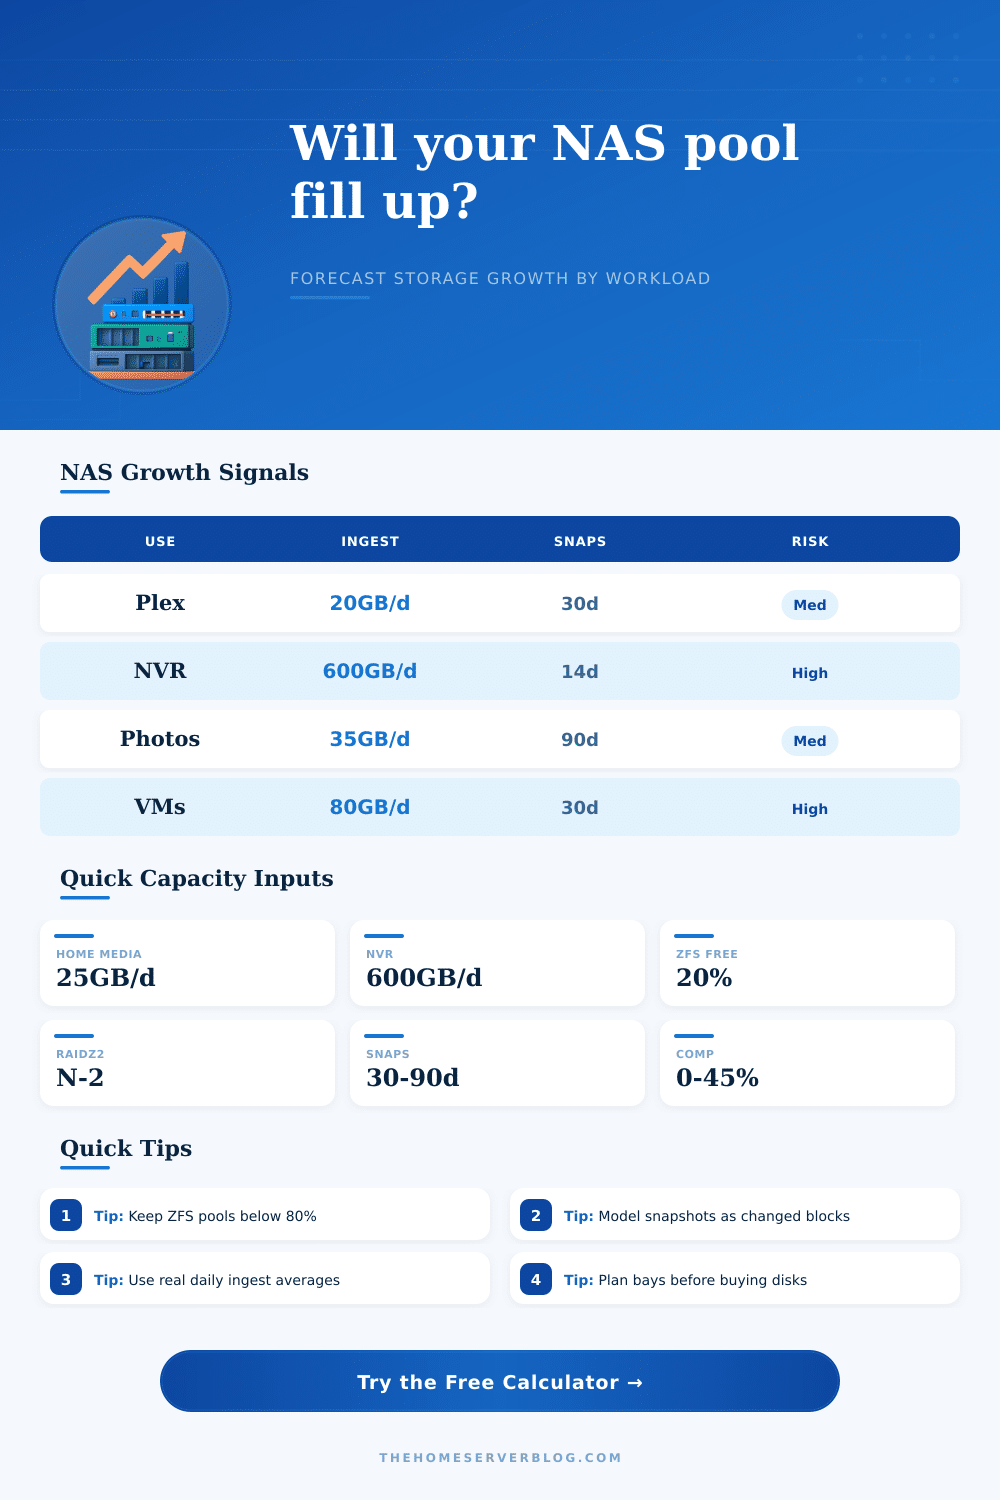
| Plex or Jellyfin library | 10-80 GB/day | 0-5% | Growth comes in bursts when ripping discs, replacing files, or importing seasons. |
| Security camera NVR | 250-1500 GB/day | 0% | Retention and bitrate dominate; snapshots usually add little value for footage. |
| RAW photo archive | 10-90 GB/day | 0-10% | Sidecars and catalogs churn more than the image files themselves. |
| VM or Proxmox datastore | 20-200 GB/day | 15-45% | Snapshots can grow quickly because virtual disks rewrite existing blocks. |
| Household backups | 15-120 GB/day | 10-35% | Model backup retention separately from NAS snapshots when possible. |
| Log and metrics archive | 5-250 GB/day | 40-75% | Text-heavy telemetry compresses well but can grow relentlessly. |
| Signal | Meaning | Best response | Watch out for |
|---|---|---|---|
| Forecast under 70% | Healthy margin | Keep measuring ingest and snapshot growth monthly. | Large one-time imports can still break the trend. |
| Forecast 70-90% | Expansion window | Plan drive replacements, add vdevs, or move cold data. | Do not count the reserve as usable working space. |
| Forecast over 90% | Capacity risk | Reduce retention, prune snapshots, or expand before the next ingest burst. | Scrubs, rebuilds, and replication jobs may need temporary space. |
| Snapshot share over 25% | High churn | Shorten history or isolate noisy VM/app datasets. | Deleted large files can remain until old snapshots expire. |
The spreadsheet told you so: You needed a sixteen terabyte drive, so you got one. It was such a joy! All that extra room. That’s right, you celebrated with open arms the very air you were breathing. Then three months pass and you find yourself hunched over a storage pool that is eighty-five percent full and humming. You watch as your Plex library throw errors when downloading new media, and your automated backups refuse to run. If you’ve built a home network storage array, chances are you’ve been there.
For most people, it wasn’t that you didn’t estimate correctly how much media you had. It was that you forgot about the invisible overhead. The data doesn’t sit still, after all; it has to be checked for parity and saved in snapshots. To predict how much storage to grow, look beyond just raw file size and understand how that gets written to disk (and how it persists over time).
How to Calculate Your True Storage Needs
How much new data hit your disks every day? That’s your daily ingest. A slow drip of security camera footage. Or maybe there is a burst of virtual machine images that gets cloned at once. Whatever it is, the calculator on top takes care of the math if you input your typical daily ingest plus your target retention window (how long you want to keep things). Then it factors in any compression savings and adds back in the overhead of snapshots and RAID redundancy. And this is where most folks falls short.
It’s all about the data, Compression is a double-edged sword. Certain types of files, like encrypted backup files and raw photographs, don’t compress well at all. They’re already optimized to resist shrinkage. Ditto for any type of compressed file; you’re not going to get much more out of it with compression. To address this, the tool lets you dial the savings down to zero. On the other hand, text documents, log files, and virtual machine caches can be easily reduced by thirty percent or more. Guessing some generic percentage doesn’t matter as much than understanding what kind of data you have here. A hopeful guess on compression could make a healthy pool a full one overnight.
The most misunderstood feature in moddern network storage is probably snapshots. The problem with snapshots isn’t that it marks down which files existed, it’s that a snapshot is a block level retention system, retaining previous versions of updated data online until they expire. On an active server where things change often and there’s heavy writing going on every hour, those old blocks adds up fast. That means if you maintain 30 days of history on an active server, all those old blocks fills up that “free” space pretty darn quick. Look at the reference table on the page: it will show you how much space is actualy available as different amounts of churn happen over time. What may appear to be ten terabytes of free space might actually only have five because it’s filled with ghost blocks of that virtual machine update from last month.
How much this costs depends entirely on the design of your drives. If you’re running a RAID-Z2 pool (which protects against two disk failures), then whether it’s a 4-disk or an 8-disk array doesn’t matter: you’ll have lost two disks worth of space to parity. That’s a flat tax on your storage density and it guarantees you will not lose data if two disks fail at once. It sounds like a lot until you remember what happens when one disk fails and you have to rebuild a big array, stress-testing the remaining disks and risking losing data. The calculator takes this parity penalty into account when calculating your usable pool size, so you get the true number instead of the marketing number stamped on the box.
For all ZFS and other filesystems like it, I recommend staying under 80% full as a general guideline. After that, performance degrades, garbage collection fails to catch up, and rebuilds becomes dangerous. If you know you will reach that number within six months, you should of scale up well before panic sets in. Do not mix old small drives with new large ones, as that just causes inefficiencies and fragmentation. Building in healthy breathing room between your data and the metal isn’t about cramming more into it, it’s about building in enough so that the system breathes.
Plan for growth based off real-life parity loss and churn rates rather than just how many files there are. This lets you manage your storage ahead of time instead of reacting to capacity alerts. You will end up with a system that takes care of your data instead of constantly reminding you of its limits. This keeps the feeling of having plenty of space alive much longer.