HomeServerBlog fiber optic planning tool
Optical Link Power Budget Calculator
Check whether a fiber span has enough optical budget after length loss, connector pairs, splices, passive splitters, transceiver class limits, receiver sensitivity, and a design margin for aging and field variation.
1Transceiver and link presets
2Optical link inputs
Loss breakdown
Deployment verdict
3Live optical budget cards
Route length multiplied by attenuation at the selected wavelength.
Mated pairs add up quickly in cross-connect and patch-panel paths.
Splitter, tap, filter, or WDM insertion loss entered as one value.
Compares engineered loss against available optical power budget.
4Transceiver class grid
5Optical budget reference tables
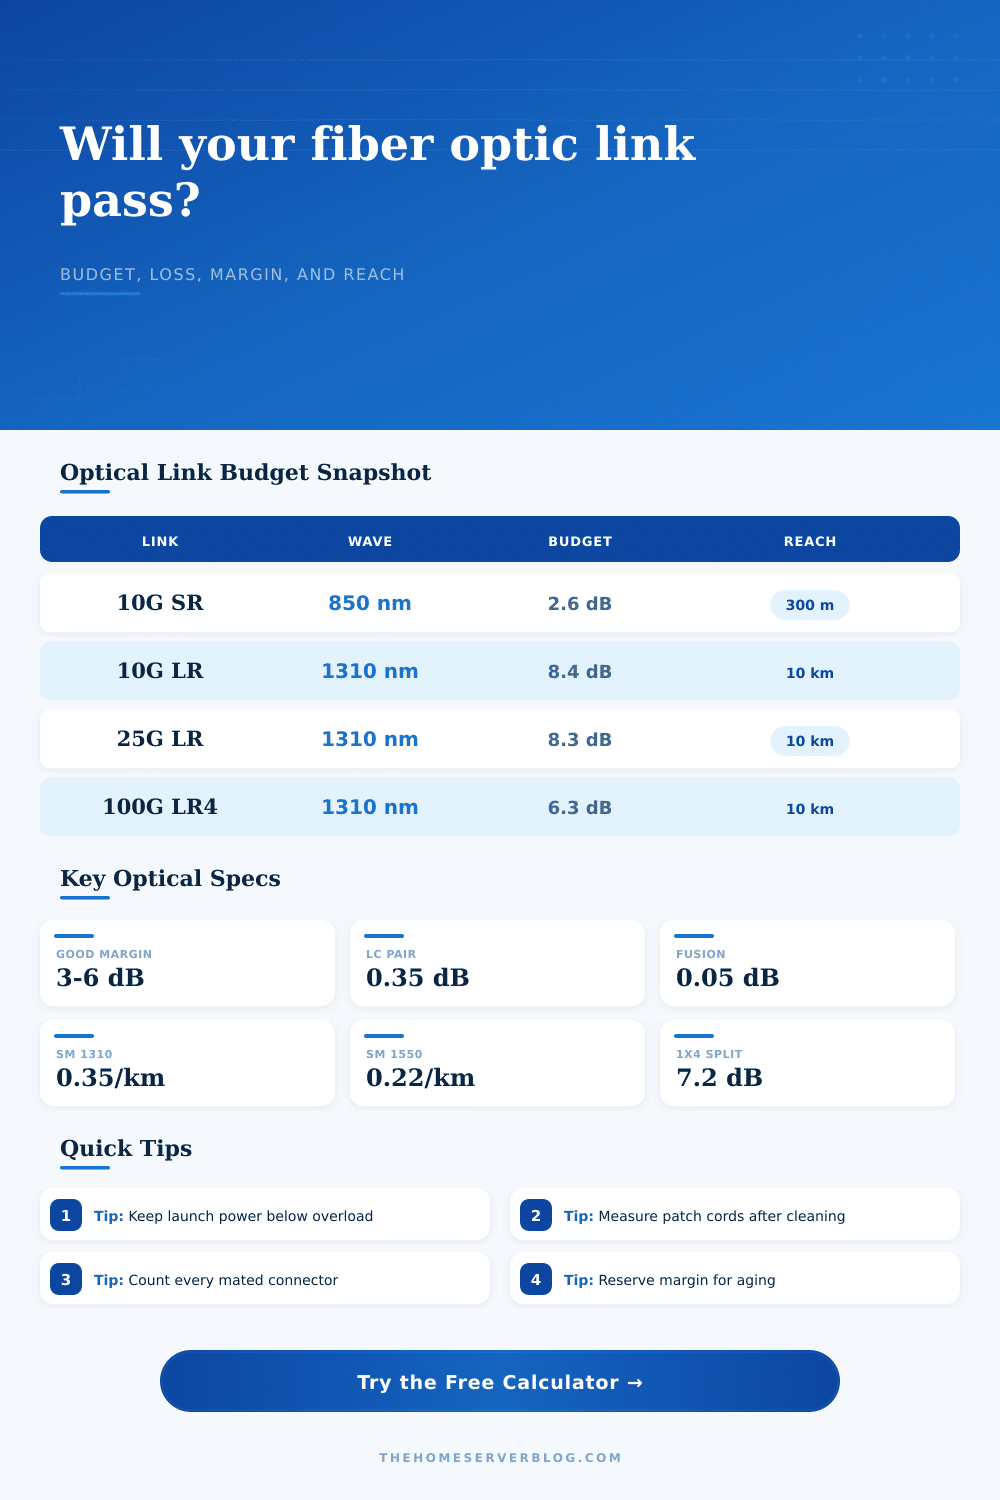
Typical fiber attenuation by wavelength
| Fiber and wavelength | Typical attenuation | Planning note | Common use |
|---|---|---|---|
| OM3/OM4 850 nm | 2.5 to 3.5 dB/km | Short multimode links are often connector-limited before length-limited. | 10G SR, 25G SR, rack rows |
| OS2 1310 nm | 0.32 to 0.40 dB/km | Use 0.35 dB/km unless a cable test report gives a better value. | 1G LX, 10G LR, 25G LR |
| OS2 1490 nm | 0.24 to 0.30 dB/km | PON downstream optics are usually splitter-budget limited. | GPON, XGS-PON |
| OS2 1550 nm | 0.20 to 0.25 dB/km | Lower span loss helps long reaches, but dispersion and optic class still matter. | ER, ZR, CWDM, DWDM |
Connector, splice, and passive loss allowances
| Item | Typical loss | Conservative value | When to increase it |
|---|---|---|---|
| LC or SC mated connector pair | 0.20 to 0.35 dB | 0.50 dB | Older patch panels, field-polished ends, or untested jumpers. |
| Fusion splice | 0.02 to 0.05 dB | 0.10 dB | Restoration work, unknown trays, or mixed contractor records. |
| Mechanical splice | 0.10 to 0.30 dB | 0.50 dB | Temporary repairs, vibration-prone locations, or outdoor enclosures. |
| WDM filter or optical tap | 0.5 to 2.0 dB | Datasheet value | Monitoring taps, mux filters, and passive demarc equipment. |
Passive splitter quick loss table
| Splitter | Ideal split loss | Practical planning loss | Typical use |
|---|---|---|---|
| 1x2 | 3.0 dB | 3.5 to 4.0 dB | Tap, redundant receive, small PON split |
| 1x4 | 6.0 dB | 7.0 to 7.5 dB | Small building distribution |
| 1x8 | 9.0 dB | 10.2 to 11.0 dB | Home lab PON or lab fanout |
| 1x16 | 12.0 dB | 13.5 to 14.5 dB | PON distribution with short feeder runs |
| 1x32 | 15.0 dB | 16.5 to 17.5 dB | Standard GPON split planning |
Example power budget outcomes
| Scenario | Budget pattern | Margin target | Planning comment |
|---|---|---|---|
| Short multimode SR | Small optic budget, short fiber | 2 to 3 dB | Connector count and dirty patch cords dominate the risk. |
| Campus LR link | Moderate budget, low fiber loss | 3 to 6 dB | Usually passes when panels, splices, and route length are known. |
| Passive split link | Splitter loss dominates | 4 to 8 dB | Use class B+ or stronger optics when fanout gets deep. |
| Long ER span | Large budget, distance-sensitive | 5 to 8 dB | Verify receiver overload on short spans and dispersion on long spans. |
6Field notes
It’s easy to spend all day on the fast transceiver train and still have a dead link because you forgot about how light works. In server rooms, this happens all the time. Some tech just bought a shiny new 10G module and plugged it into their switch. The port blink green for a second and goes dark. Fiber is fine. Optic is fine. Usually, the total loss through the cable run were more than the sensitivity of the receiver. This made the signal too faint for the receiver to decode.
That kind of heartbreak can be avoided if you run the numbers first with this optical link power budget calculator. It’ll estimate your connector impact, your span loss and your remaining margin so you know whether your design will stand up to real world conditions.
How to Plan Your Fiber Optic Link
It’s just some basic arithmetic; it’s where people struggle to put the numbers into the equation. First you begin with the transmit power of your transceiver minus the receive sensitivity: this is your operating budget. Then you remove any losses incurred by your light along its journey. This includes all splices, splitters and mated connector pairs as well as fiber itself, which will weaken your signal over distance. Enter how many components are in your route and how long it is, and the calculator does the rest for you. Saves you from having to chain together attenuation coefficients.
What most engineers fail to remember is that a dirty connector can cost you more loss then a kilometer of fiber. Half a decibel of loss, what seems like nothing. May be half of your margin on a short reach multimode link. And that one contaminated LC pair can add it.
Most casual planners under-estimate the wavelength. Attenuation at 850 nanometers is much worse compared to light at wavelengths of 1310 or 1550. This is why we use multi-mode fiber in closets and racks with short reach modules and single mode for campus runs with long reach modules. The page has a reference table explaining how to pick reasonable loss factors based off typical attenuation numbers. Running 10G SR over OM3 fiber means you’re up against a high baseline loss number. Keep your connector counts down and keep the physical path short. Running 10G LR over OS2 single mode means you’ve got lots of budget for length but you want to be mindful of dispersion issues at far end.
A safety net is the design margin between what works in a lab test and what works in a production deployment. No matter how clean a fiber link may be initially, it won’t remain so indefinitely. Patch cords bend, connectors become dirty, splices degrades a bit over decades. Plan to leave at least three decibels of margin for these inevitable changes. So if you have zero margin left after your calculation, congratulations! Your link may be working today… until somebody swaps out a jumper and it fails next Tuesday.
The tool takes your reserved margin and your non-fiber losses into account. It then gives you an estimate of your reach, which is a hard limit on how far you can push the cable. When making plans, don’t plan based off what you think the transmit power is going to be. Plan using the minimum launch power. Transmitters age. Temperature varies. They will not put out as much power as their datasheet shows as a peak number. Minimum launch power and worst-case sensitivity make for a link that can survives the bad day. Better to have some margin you never need than to find out there was none when the rack is closed.
Lastly, don’t think of this as some sort of certification device, although it’s a planning tool. It allows you to plan out a workable solution and anticipate areas where it might fail. Once the fiber is in place, however, run an OTDR or appropriate optical power meter down the link to make sure things are good. The meter shows you what’s happening; the calculator shows you what should of happening. Let the calculator guide your plans so they are strong and realistic. Light is powerful… and unforgiving. Plan well, and let the light bring your data to wherever you want it to go.