HomeServerBlog fiber power worksheet
Optical Margin Calculator
Compare the optical margin you measure on a live receiver with the design margin you expect from transmit power, passive loss, aging, dirty connectors, temperature derate, dispersion penalty, FEC gain, and the margin target for the link.
1Optical margin presets
2Power, loss, allowance, and FEC inputs
Optical margin breakdown
Margin verdict
3Live optical budget indicators
Calculated from Tx power and total modeled losses.
Passive plant plus aging, dirt, temperature, and dispersion.
Difference between live DOM power and modeled receive power.
Passive loss allowed while still meeting target margin.
4Optic type comparison grid
5Optical margin reference tables
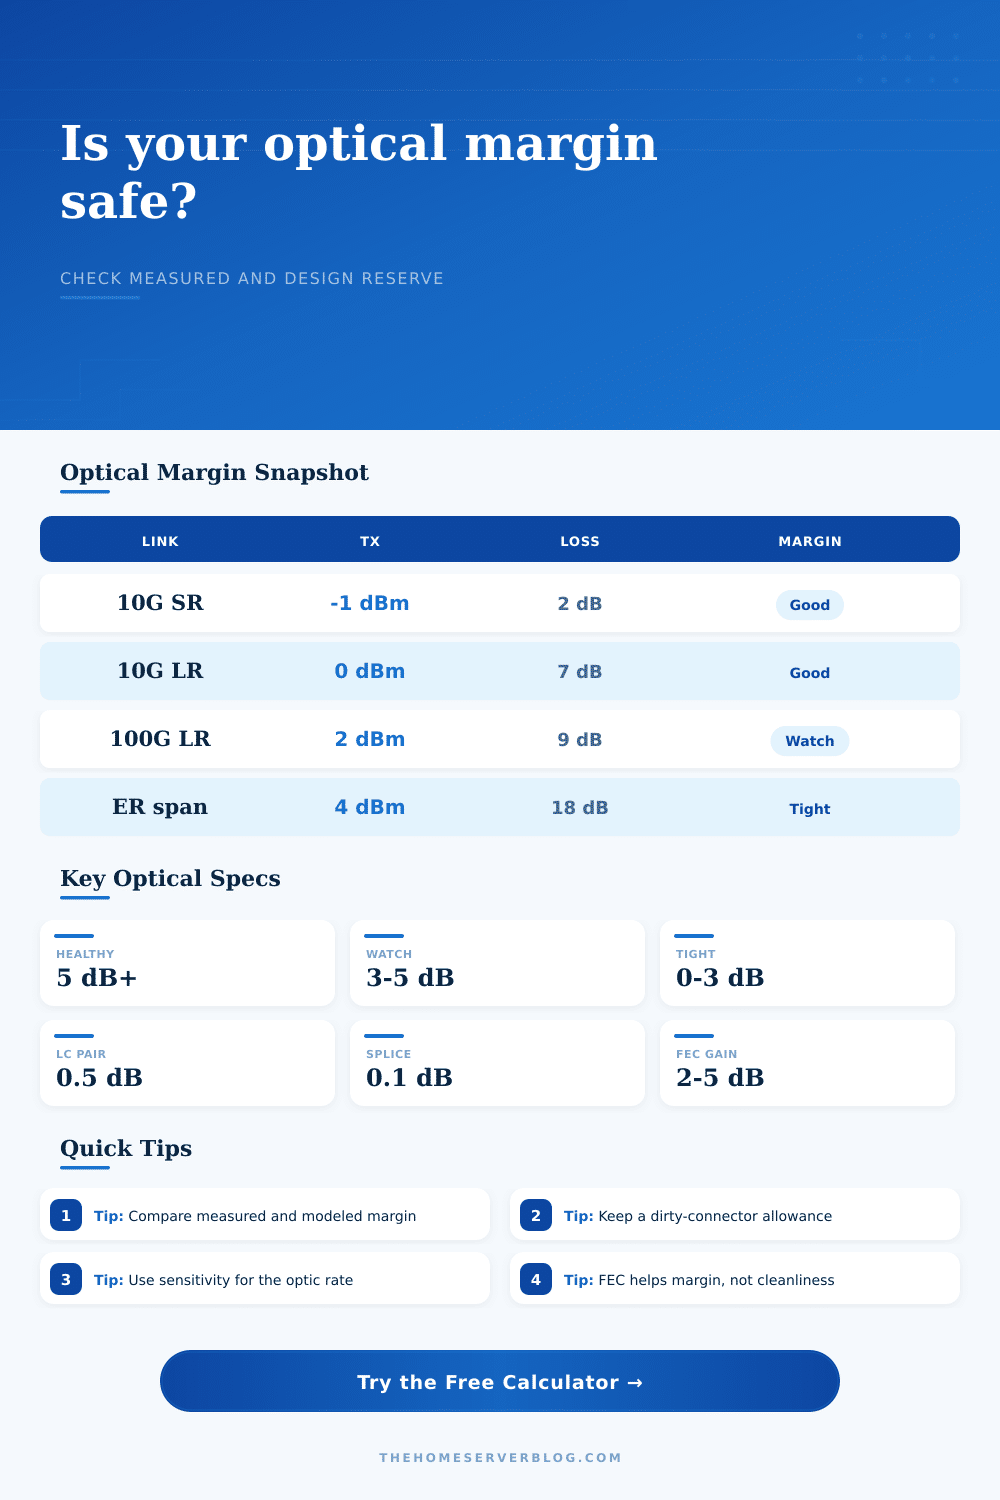
Margin health bands
| Limiting margin | Status | Likely behavior | Action |
|---|---|---|---|
| 6 dB+ | Healthy | Good reserve for connector movement, aging, and modest plant changes. | Document measured Rx and keep the patch path clean. |
| 3-6 dB | Production watch | Normally usable, but future loss or dirty panels can erase reserve. | Clean, inspect, and compare both ends after maintenance. |
| 0-3 dB | Tight | Errors or flaps may appear during temperature shifts or repatching. | Reduce passive loss, remove suspect adapters, or use a stronger optic. |
| Under 0 dB | Fail | The link is below the selected target or below receiver sensitivity. | Fix optical plant before trusting the circuit. |
Passive loss planning values
| Component | Conservative loss | Cleaner target | Planning note |
|---|---|---|---|
| LC or SC mated pair | 0.5 dB | 0.2-0.35 dB | Dirty or worn connector faces can exceed the conservative number. |
| Fusion splice | 0.1 dB | 0.03-0.05 dB | Use splice tray records if you have real OTDR values. |
| Single-mode fiber | 0.35 dB/km at 1310 nm | 0.20-0.25 dB/km at 1550 nm | Use the optic wavelength and cable test report when available. |
| Multimode fiber | 3.0 dB/km at 850 nm | 1.0 dB/km at 1300 nm | Short runs are usually connector-limited, not fiber-attenuation limited. |
| Splitter, mux, or tap | Device specific | Use data sheet | These components often dominate passive loss. |
Common optic budget reference
| Optic family | Example reach | Rough budget | Margin concern |
|---|---|---|---|
| 1G SX or LX | 220 m to 10 km | 7.5-10 dB | Usually forgiving unless patch panels are dirty or over-adapted. |
| 10G SR or LR | 300 m to 10 km | 7.3-10.3 dB | Common lab links pass easily when connector count is controlled. |
| 25G SR or LR | 100 m to 10 km | 5.7-9 dB | Higher rate links leave less room for sloppy multimode paths. |
| 40G LR4 or 100G LR4 | 10 km | 6-10 dB | Lane imbalance and FEC counters matter more than total Rx alone. |
| ER, ZR, DWDM | 30 km and beyond | 14-28 dB | Check dispersion, optical power limits, mux loss, and receive overload. |
Margin fault clues
| Symptom | Margin clue | Likely source | Fast check |
|---|---|---|---|
| Measured Rx is much lower than design | Actual margin trails design margin | Dirty connector, wrong patch, bend, or unexpected splitter. | Clean and inspect both ends, then compare DOM again. |
| Design margin is lower than actual | Model is conservative | Loss allowance may include more dirt, aging, or dispersion than present. | Keep the allowance if the plant will be repatched often. |
| Errors rise with cabinet heat | Temperature derate is too small | Hot optics, weak Tx power, or marginal receiver performance. | Check DOM temperature, Tx power, and FEC counters. |
| Good power but poor lane health | Total margin hides lane issue | Parallel optic, WDM lane, dirty MPO, or dispersion imbalance. | Review per-lane Rx, pre-FEC BER, and corrected codewords. |
6Optical margin tips
This calculator estimates receive-side optical power reserve. Confirm transmitter minimum and maximum output, receive overload, wavelength, fiber type, splice records, connector inspection, lane health, FEC counters, and vendor optic specifications before commissioning production links.
That’s what you think happens. A photon goes from A to B, and voilà! Done. But it doesn’t.
It has to endure the damage of time (aging lasers, dirty connectors), temperature fluctuations, and general wear-and-tear on all the physical stuff that makes up an optical network. When your HVAC systems cycles at 3 AM, optical margin is there to ensure your link stays up. It’s the delta between a peaceful night in the office vs. You are running around checking servers in the server room.
Why You Need Optical Margin
People look at their positive recieve power and they pat themselves on the back. They should stop doing that. Having positive power without any optical buffer when operating close to receiver sensitivity mean jack-squat in the face of real world conditions.
So after you feed the parameters to the link calculator, what does it do? It does the math for you. You won’t have to guess how much connector loss an optic can handle. That’s all in definition of those parameters, which is where the effort comes into play. You need to define measured reality versus theoretical design.
For example, you can plug in current Digital Optical Monitoring values into the tool. You are also asked to provide a modeled budget with allowance for heat, age and dirt. Seeing both sides tell you the truth. While the link might appear fine now, does it have enough design margin to perform properly in three years when lasers decline and connectors accumulates debris?
Dirty connectors is the main weakness of optical networking. We expect that a shiny LC face plate is clean, it isn’t. There’s oil, there’s dust, there are scratches. Hence the dirty connector penalty, which is its own input. Don’t assume all mating pairs has zero loss. A single bad face with dust on it can weaken your signal by several decibels; it’ll kill your budget. If you don’t account for this allowance, your design margin appears solid. Until the guy in the rack have to repatch something. Bam! Half your links goes down.
Guess what? It wasn’t just about loss of signal in the fiber. It was also about environmental damage and human error. Most network guys don’t think about it, but temperature is important. Optics has specified operating ranges, but behave different when surrounding conditions change from what’s comfortable in the lab. As lasers warm, their power output drifts. Receivers gets less sensitive during a cold snap. That’s why there’s an input called the temperature derate input. It factors in how optics act in the real world. If you keep your switches in an unheated closet or hot data hall, you want that buffer.
Then there’s the matter of dispersion, which is a quiet one. On high speed links like 25 or 100 gigabits, the light pulse disperse across time at distance. This smears one bit into other bits, which creates interference. While there may be enough power to get through, the signal gets smeared so it’s unintelligible. The eye diagram closes. The dispersion penalty shows that power isn’t the only factor.
This doesn’t solve all problems. Forward error correction (FEC) can hides some bit errors, allowing you to increase the decoding distance by a few dBs. That’s fine, and yes, you should of give yourself credit in the calculator for it. But don’t mistake FEC for a get-out-of-jail-free card when your physical-layer conditions suck. A negative margin without FEC means your physical layer sucks. Barely-positive FEC means you’re betting on the error-correction method to bail out your marginal physical condition. Better to have a robust physical margin and rely on FEC when noise occurs.
You get a verdict back about where you stand. Are you watching, healthy? Or are you in the danger zone? If you’re healthy, you’ve got some wiggle room: add a patch cord, change one out, ride out a hot summer day without worry. If you’re tight, it’s time to document all components, then double-check each connection before you touch anything.
Resilience isn’t just about connectivity. Margin management puts you on the path to resilient networks. When you stop chasing ghosts by staring at raw power levels, you’ll build networks that last. The lights come on, go from A to B. But only if you honor the losses between them.