OSPF Cost Calculator
Model per-link costs, total route cost, and upgrade impact across mixed-speed home and lab networks.
Full Breakdown
| Hop | Speed | Cost | Running total |
|---|
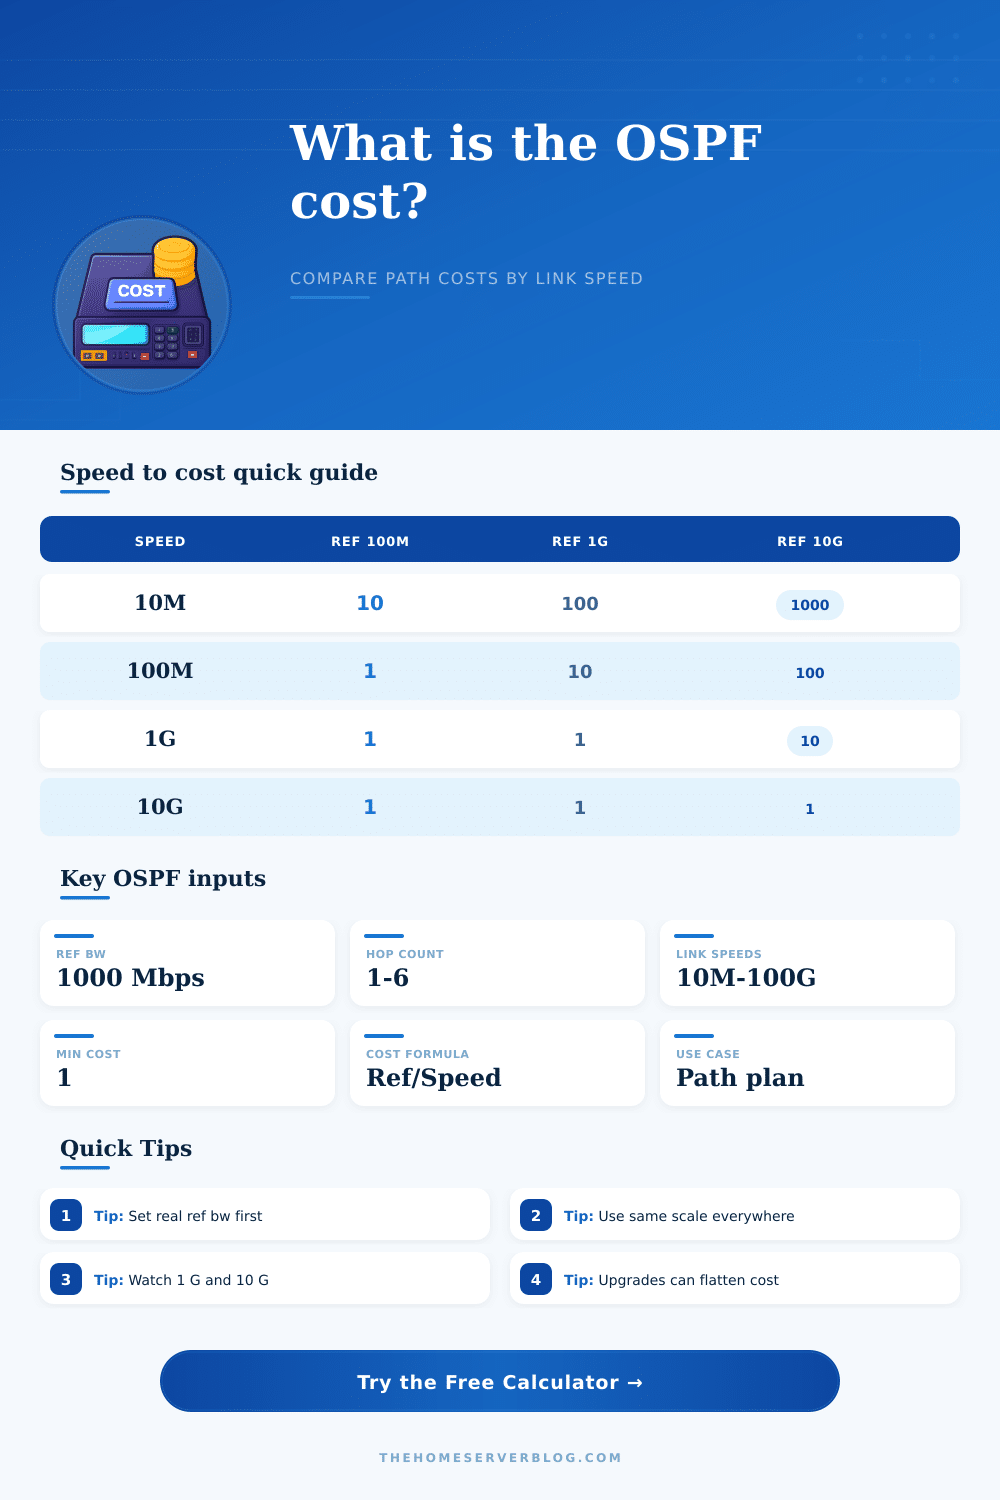
| Speed | 100M ref | 1G ref | 10G ref |
|---|---|---|---|
| 10 Mbps | 10 | 100 | 1000 |
| 100 Mbps | 1 | 10 | 100 |
| 200 Mbps | 1 | 5 | 50 |
| 500 Mbps | 1 | 2 | 20 |
| 1 Gbps | 1 | 1 | 10 |
| 2.5 Gbps | 1 | 1 | 4 |
| 10 Gbps | 1 | 1 | 1 |
| 100 Gbps | 1 | 1 | 1 |
| Ref bw | Best fit | Common feel | Watch for |
|---|---|---|---|
| 100 Mbps | Legacy | FastEthernet | 1G flattens |
| 1000 Mbps | Home lab | Gigabit base | 100M is slow |
| 10000 Mbps | Mixed core | 10G aware | 1G becomes 10 |
| 40000 Mbps | Spine tier | 40G aware | Use wide refs |
| Path cost | Meaning | Typical shape | Design move |
|---|---|---|---|
| 1-5 | Very flat | All fast hops | Good ECMP odds |
| 6-20 | Normal mix | One slower hop | Check ref bw |
| 21-60 | Wide spread | Legacy section | Upgrade bottleneck |
| 61+ | Heavy path | Old access chain | Retune metrics |
The cost attribute for OSPF are the numerical value that determines the path for the network traffic. The cost for OSPF is calculated based off the speed of the network interface. The total cost for a path is calculated by adding the costs for each individual interface for a path.
Furthermore, the OSPF protocol will always select the path that has the lowest cost. If the cost values for OSPF are incorrect, the network traffic will take inefficiently paths and experience bottlenecks within the network. The reference bandwidth for OSPF is the value that is used in a formula that calculates the cost for each interface.
OSPF Cost and Reference Bandwidth Explained
More specificaly, the reference bandwidth is divided by the speed of the interface to calculate the cost for that interface, and the result of this division is rounded down to a minimum of one. For example, if the reference bandwidth is set to 100 Mbps, then both 1 Gbps and 10 Gbps links will have same cost for the network traffic. However, if the reference bandwidth is set to 10 Gbps or higher, then the costs will be calculated differently for each link speed.
A mismatch in the reference bandwidth will lead to errors in the network. A mismatch in the reference bandwidth mean that each router in the network will calculate the cost of each link differently. Each router must use the same reference bandwidth for each link in the network.
Furthermore, the reference bandwidth must be set to a high enough value to ensure that each router can differentiate between high speed links. The total cost for each path will affect the function of the network. More specificaly, the total cost for each path will determine if the path will be used for load balancing or if the path will act as a bottleneck.
Paths with a total cost under five is considered to be equal cost and can be used for load balancing. Paths with a total cost over twenty are considered to be legacy paths and can slow down the traffic moving through the network. For instance, a path that contains three 1 Gbps links and one 100 Mbps link will have a higher cost for the 100 Mbps link than for the 1 Gbps links.
Thus, the total cost of the path will be higher than if the path contained only 1 Gbps links. The throughput for each link in the network should be tested. The reason for testing the throughput is that the actual throughput of each link can be lower than the speed of the nominal interface.
For instance, the throughput can be lower due to duplex settings for the links or due to Wi-Fi overhead. Therefore, the calculation of the cost for each link may not be as accurate as possible. A calculator can be use to calculate the total cost of each link in the network.
Using a calculator to calculate the cost will allow the network administrator to identify any bottlenecks within the network, as well as to determine the benefits of upgrading the network hardware. If the traffic for the network is experiencing issues and is taking inefficient paths, the reference bandwidth for the network should be adjusted to ensure that the cost for each link reflect the actual speed of the networks interfaces.