Power Over Ethernet Efficiency Calculator
Estimate the true end-to-end efficiency of a PoE run from PSE output, PD load, cable resistance, voltage, pair count, converter efficiency, duty cycle, temperature, and reserve margin.
PoE efficiency results
| End-to-end efficiency | Typical meaning | Likely cause | Action |
|---|---|---|---|
| 90%+ | Excellent for PoE | Short run, higher voltage, efficient PD converter | Keep the reserve and document the baseline. |
| 82% to 90% | Normal working range | Moderate cable and conversion loss | Check hot locations and startup draw. |
| 72% to 82% | Loss is visible | Long run, small copper, high current, warm cable | Use four-pair PoE, larger copper, or move the PSE closer. |
| Below 72% | Inefficient or marginal | Low voltage passive PoE, CCA cable, or too much load | Redesign before relying on the run. |
| Cable profile | Typical conductor resistance | PoE fit | Efficiency note |
|---|---|---|---|
| 22 AWG industrial copper | About 5.4 ohms per 100 m | High-power or hot runs | Lower voltage drop, better reserve on 802.3bt. |
| 23 AWG solid copper | About 6.8 to 7.2 ohms per 100 m | Cat6 and Cat6A permanent links | Good default for long AP and camera runs. |
| 24 AWG solid copper | About 8.9 ohms per 100 m | Cat5e and many Cat6 links | Fine for many 802.3af and 802.3at devices. |
| 26 AWG stranded patch | About 13.7 ohms per 100 m | Short patch leads | Avoid using long thin patch cable as the main powered run. |
| CCA cable | Often much higher than copper | Not recommended | Expect higher loss and weaker safety margin. |
| Loss source | Formula used | Where heat appears | Design note |
|---|---|---|---|
| Cable copper | I x I x loop resistance | Inside the cable bundle or pathway | Temperature and small conductors increase this loss. |
| PD converter | PD input minus PD load | Inside the powered device enclosure | Warm cameras and APs may throttle sooner in sealed spaces. |
| Reserve margin | PSE watts held aside | Not consumed in the model | Protects against boot peaks, aging, and LLDP class changes. |
| Annual energy | PSE draw x duty cycle x 8760 | Total input energy over time | Use duty cycle for cameras, AP radios, and devices with sleep modes. |
| Scenario | Typical inputs | Expected behavior | What to check |
|---|---|---|---|
| Access point on Cat6 | 12 to 22 W, 30 to 60 m, 48 to 54 V | Usually strong efficiency if converter is modern | Peak radio draw and warm ceiling spaces. |
| Fixed camera run | 6 to 13 W, two-pair PoE, 24 AWG | Small cable loss, low total heat | IR illuminator night draw and outdoor temperature. |
| PTZ or heater camera | 25 to 55 W, four-pair PoE, long cable | Cable and PD heat become important | Startup current, motor peaks, and 802.3bt class support. |
| Passive 24 V injector | 10 to 30 W, low voltage, custom cable | Current is higher, so loss rises quickly | Voltage at the device under load. |
The Ethernet cable is clipped on the rack, pulled tight, and the status LED blinks green. It’s online. But somewhere between your rack and that little green light, power is being lost.
That loss shows up as wasted watts. Watts that escape as heat coming from the copper strands and the little DC converter in access point. For most installers, this doesn’t become an issue until they’re staring at their budget with nothing left over or a camera are rebooting one frigid morning when turning everything back on.
Why Power Gets Lost in Ethernet Cables
Data equals power, so why not get it for free down the same wire? That’s where they’re wrong.
Define your particular run, and then the calculator above will do all the math for you. It won’t simply indicate whether or not the device turn on. It will indicate how much of the source power is actualy making it through to the electronics, and how much is going up in smoke as heat.
Remember, delivering power over copper are a negotiation between resistance, current, and voltage. Ohm’s law doesn’t care about your service level agreement. Ohm’s law just turns energy into heat.
The first thing to check is the gauge of your cabling and its length. For example, 24 AWG solid copper cable is a common choice for Cat6 runs. Its resistance is already on the higher side. This resistance increase over length.
The calculator can also be dialed for temperature; as cables warm they increases their resistance. In super-hot server rooms? Sun-baked ceiling runs? While you may consider a 30-degree room “neutral,” the math indicates that copper resistance go up about 0.39 percent for each degree Celsius higher than 20. That’s a low coefficient, but it multiplies over a long run with lots of current. Less voltage get to the device.
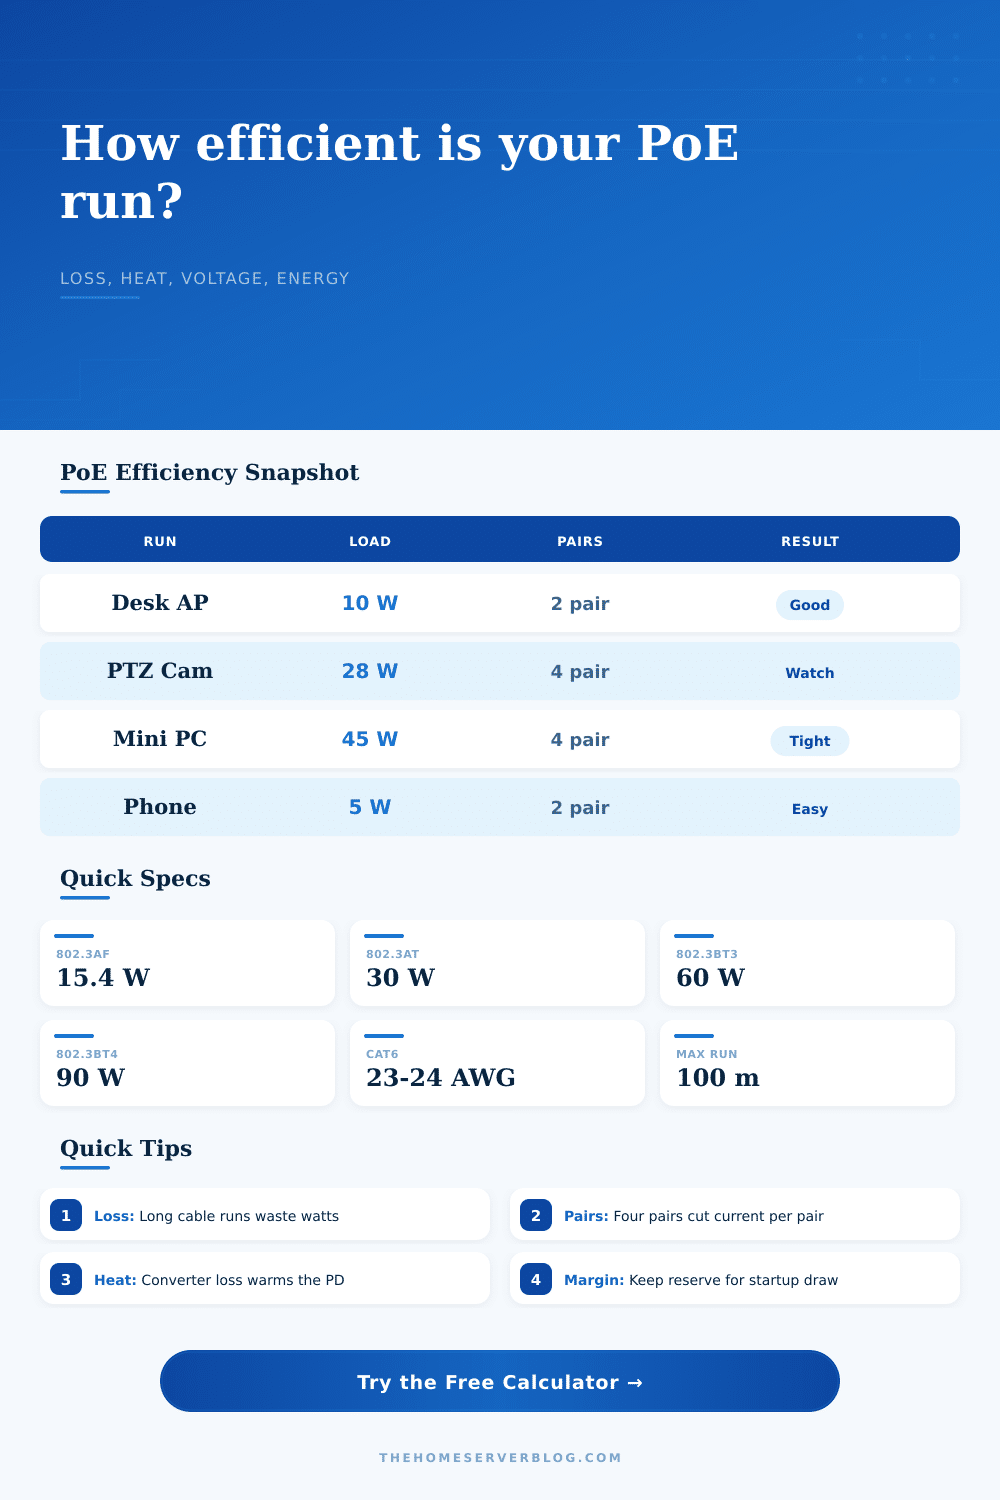
There’s also the matter of pairs. Most older standards use only two pairs for power, so all the current must pass through a single electrical loop. The newer ones (like 802.3bt) actualy use all four pairs, which halves the current going through each pair.
Less current mean less resistance loss. Because resistance loss increases with the square of the current, cutting the current to a quarter reduces the power lost in the cable by a quarter. That’s where four-pair PoE gets nice on paper. It’s not just the raw wattage. It’s the efficiency of it.
The calculator lays it out so that you can see exactly what happens to the wattage before it ever reaches the device input.
Another hidden variable is the converter efficiency within the powered device. While switching regulators are good, they’re not perfect. If it’s an 88 percent efficient converter, that means 12 percent of the power entering the device will become heat inside the plastic enclosure. That heat has nowhere to go in a sealed access point hanging from a ceiling tile. Even if power supply is technically adequate, the device may throttle its Wi-Fi radios to protect itself.
The tool separates out the converter and cable loss so you know where the heat comes from. Device heat warms the hardware. Cable heat warms building.
The reserve margin is something most folks overlook. Some portion of the power available should of been reserved to allow for aging components as well as startup surges. When a battery-free thing turns itself on, it take a burst of current to top off whatever capacitor-based storage it has. Sizing your run precisely for steady state can result in a reboot because the surge pulls the voltage below the dropout threshold. You don’t want to be right up against the limit. With the percent reserve option, you can ensure this doesn’t happen.
Last but not least, consider the yearly power consumption. For a single camera it might sound like splitting hairs, but when you multiply that power draw across hundreds of endpoint in an environment, it all adds up. This is where the duty cycle input come into play. Not everything is running at max load 24/7. Set the real-world power usage to get a more accurate idea of the energy expense.
But the key is figuring out what’s really getting measured. Efficiency isn’t a pass/fail. It’s a scale of efficiency. The amount of waste.
Quantify that waste and you’re no longer guessing, you’re engineering. You are no longer wishing for the green light on the LED, but instead knowing why the LED is green.
Respect the resistance, keep the reserve, and the power will follow.