Uplink Oversubscription Calculator
Estimate how many access-port gigabits are sharing your uplinks after utilization, burst demand, redundancy, traffic direction, target ratio, and headroom are applied.
Uplink sizing result
| Uplink design | Usable model | Best fit | Watch point |
|---|---|---|---|
| All active | Every uplink counted | Lab LAGs and routed ECMP | Hashing may strand one flow on one link |
| N+1 | One uplink removed | Closets with a spare failure path | Two-link designs fall to one link |
| Dual-homed | Half the uplinks survive | Two cores, MLAG, vPC, or stack split | Make each side carry the busy hour |
| Active/standby | One active side counted | Simple firewalls and small edge pairs | Standby bandwidth is not normal capacity |
| Access block | Uplink block | Line ratio | Typical note |
|---|---|---|---|
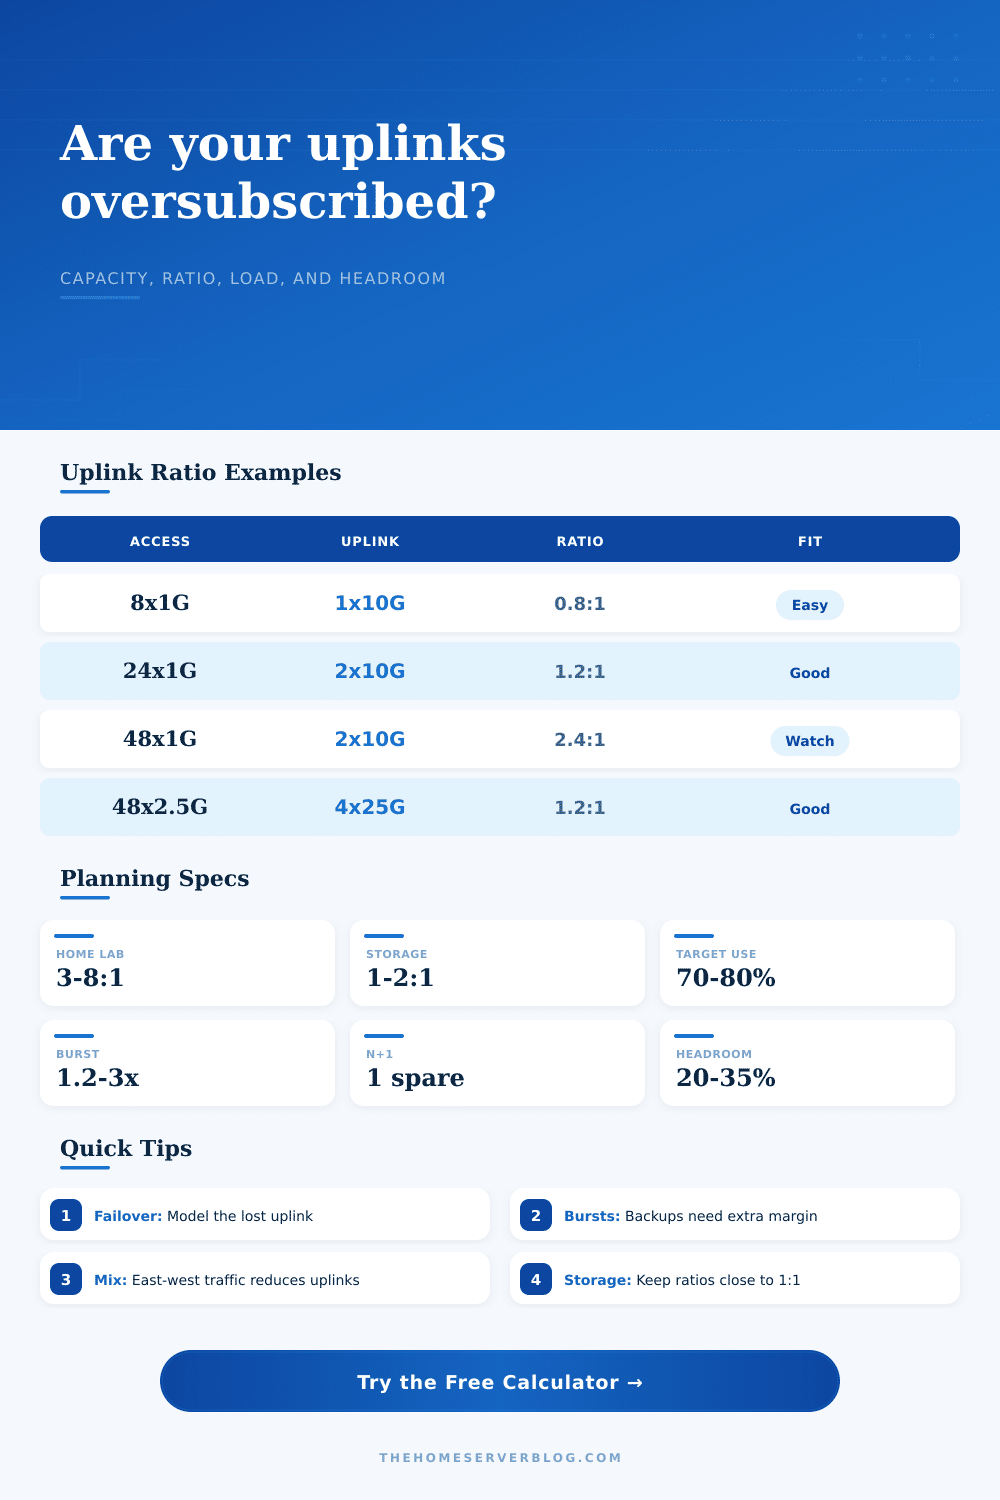
| 8 x 1G | 1 x 10G | 0.8:1 | More uplink than access line rate |
| 24 x 1G | 2 x 10G | 1.2:1 | Comfortable for small racks |
| 48 x 1G | 2 x 10G | 2.4:1 | Common access closet target |
| 48 x 2.5G | 4 x 25G | 1.2:1 | Strong Wi-Fi aggregation plan |
| 24 x 10G | 4 x 25G | 2.4:1 | Works only if storage bursts are controlled |
| Direction mix | Uplink share | Example traffic | Planning effect |
|---|---|---|---|
| Mostly north-south | 95% | Internet, WAN, firewall, SaaS | Almost all access demand hits uplinks |
| Mixed office/lab | 80% | Clients plus local services | Good default for small networks |
| Server VLANs | 60% | Apps, NAS, hypervisors | Local switching relieves uplinks |
| Storage east-west | 40% | Backup, iSCSI, replication | Keep storage inside the same fabric |
| Cluster local | 25% | VM traffic inside a leaf pair | Line ratio may look worse than actual load |
| Target band | Suggested ratio | Good use case | Capacity habit |
|---|---|---|---|
| Storage or migration | 1:1 to 2:1 | NAS, VMotion, backup repository | Reserve 30% or more |
| General server leaf | 2:1 to 4:1 | Containers, lab VMs, mixed services | Watch burst windows |
| User access edge | 4:1 to 8:1 | Desktops, phones, printer VLANs | Use N+1 checks |
| Low duty cycle access | 8:1 to 12:1 | IoT, cameras, sensors, light clients | Validate peak events |
You know the feeling. Everything worked fine until Tuesday at 2 PM: the backups started. The updates pushed. Someone decided to video conference. The uplinks got saturated. Packets dropped.
The network works fine until Tuesday at 2 PM, then Tuesday at 2 PM, the backups started. The updates pushed. Someone decided to video conference. The uplinks got saturated. Packets dropped. The switch’s lights blinked furiously; productivity flatlined.
Why Your Network Slows Down
No, you didn’t lack capacity. You simply miscalculated how that capacity was shared. Oversubscription is the art of lying to yourself about traffic. You assume that users won’t try to max out their port at the same time. That works for web browsing but doesn’t work for bulk transfer.
The calculator does the math for you. It goes beyond just a simple ratio; it forces you to ask more difficult questions around behavior and failure. The only way to trust the tool is to know what it’s realy measuring.
Let’s begin at the beginning, the raw math. There are uplink ports and there are access ports. The ratio may be 4.8-to-1 (forty-eight gigabit ports connected to two ten-gigabit uplinks). Sure, it looks good on paper for a desktop deployment… but paper doesn’t consider burst factor.
It’s that multiplier which kills most design. Security updates, virtual machine migrations, backups… they don’t trickle; they slam. The truth is, things happen at the same time; a burst factor of 1.6 or better indicate this fact. Your design might last through an average day but implode during the backup window? Not a design. It’s a time bomb.
It’s odd, but redundancy changes the math. “I’ll add another uplink because it will give me more capacity” isn’t right. For an N plus 1, you don’t subtract the redundant link from the total and see what’s left. That’s mistake people make. They calculate assuming all links is being used at full capacity. A network needs to function when one of those links are down. That’s what you’re buying.
Use the calculator to select your redundancy mode: do you have a simple spare, do you have dual homing, or do you have active standby? Whatever you pick, there’s less capacity available. Capacity means reliability, not speed. Get comfortabley with this tradeoff now.
Direction matters more then speed. Much of today’s network traffic travels laterally. Data rarely touches the uplinks; it remains in same switch stack or cluster (east-west). Your busy ports are your access ports and they’re carrying all your local server communication or local storage replication traffic. Your uplinks can be idle if most of that traffic stay local.
This is captured by direction mix setting. For example, if you set it at 80 percent, most traffic heads north to the internet or core. Set it at 40 percent and most traffic goes local. Get this wrong and you’ll end up over-buying expensive uplinks for traffic that never leaves closet.
Headroom is a buffer against chaos. Unexpected growth? Control plane overhead? Hashing imbalances? All of these consume a piece of your theoretical bandwidth. And leaving 20-35 percent headroom isn’t wasteful. It’s insurance. You are running at max capacity just to tread water.
The page has a reference table laying this out in various scenario. Because data integrity relies on steady data flow, storage needs low ratios. Since human traffic is both forgiving and unpredictable, user access can handle higher ratios. Don’t guess. Model the failure case with the tool.
It is not perfect case. When the backup hours are at their peak and one of the links fail and the numbers look tight…you don’t have enough capacity. The math doesn’t lie. It won’t wait while you finish your spreadsheet. Create that margin now or you will pay for it as downtime later. You should of created it sooner.