PUE Improvement Calculator
Compare a measured home server PUE against practical airflow, UPS, cooling, and consolidation improvements.
Full Breakdown
Mini PC Cluster
4 to 8 Bay NAS
Tower Server
1U Rack Server
2U Storage Server
PoE Network Stack
GPU Compute Node
Mixed 12U Rack
| PUE Band | Overhead Above IT | Home Lab Meaning | Most Useful Next Check |
|---|---|---|---|
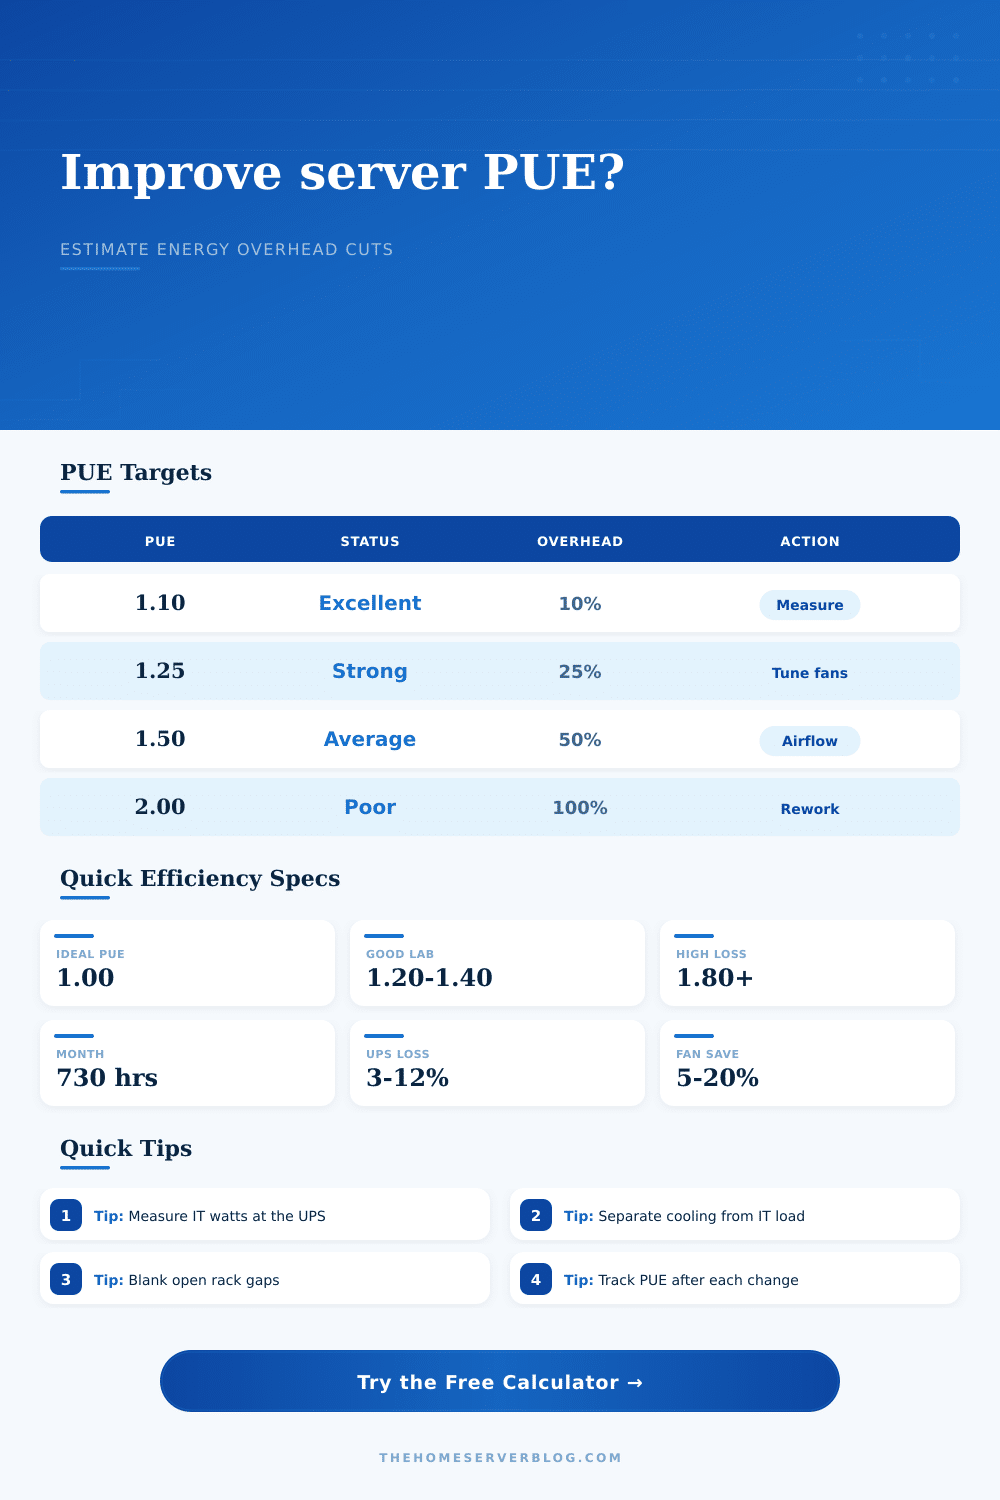
| 1.05 to 1.15 | 5% to 15% | Very efficient measured boundary | Confirm meter placement and runtime average |
| 1.16 to 1.35 | 16% to 35% | Strong home server result | Review UPS load level and fan curves |
| 1.36 to 1.70 | 36% to 70% | Common closet or small rack range | Separate cooling watts from IT watts |
| 1.71 to 2.20 | 71% to 120% | High overhead or warm location | Check exhaust recirculation and room cooling |
| Above 2.20 | Over 120% | Likely measurement or cooling issue | Audit boundary, dehumidifier, and HVAC loads |
| Improvement Lever | Typical Reduction | Best Fit | Measurement Signal |
|---|---|---|---|
| UPS eco mode or right-sizing | 3% to 10% of overhead | Lightly loaded UPS systems | Lower input watts at same IT load |
| Blanking panels and cable cleanup | 5% to 18% of overhead | Rack gear with open gaps | Lower inlet temperature spread |
| Fan curve tuning | 5% to 20% of overhead | NAS, switches, and lab servers | Stable component temps with fewer fan watts |
| Exhaust path separation | 8% to 30% of overhead | Closets, cabinets, and garages | Reduced room cooling runtime |
| Hardware consolidation | 10% to 45% of IT load | Many idle boxes or old switches | Lower IT watts before PUE is applied |
| Measurement Boundary | Includes | Excludes | Use When |
|---|---|---|---|
| Smart plug plus UPS | UPS input and IT output estimate | Room fan or HVAC energy | Small NAS or mini PC lab |
| Metered PDU | Rack IT load by outlet or bank | External cooling and ventilation | Rack-mounted gear |
| Branch circuit meter | Rack, fan, and local support loads | Shared household HVAC | Dedicated server closet circuit |
| Room submeter | IT, cooling, fans, and support loads | Unrelated rooms or circuits | Garage, basement, or lab room |
| Scenario | Starting PUE | Realistic Target | Common Limiter |
|---|---|---|---|
| Basement NAS shelf | 1.20 to 1.45 | 1.12 to 1.30 | UPS efficiency at low load |
| Closet 12U rack | 1.45 to 1.90 | 1.25 to 1.55 | Warm air recirculation |
| Garage rack in summer | 1.75 to 2.50 | 1.40 to 1.85 | Ambient temperature swings |
| Mini PC cluster | 1.10 to 1.35 | 1.06 to 1.20 | Many small power adapters |
Those who build their own home labs tend to pay attention to server gear, while overlooking the inefficiency in surrounding environment. Sure, there are power supplies that is more efficient than others. But your whole room work hard to keep equipment from overheating. How does that make your efficiency numbers look?
That’s where Power Usage Effectiveness comes into play. It considers how much “real” energy IT equipment uses compared to total energy used by the facility. The closet fan, the ambient heat you have to battle, the UPS loss; all count toward facility energy use for a home server.
How to Save Energy in Your Home Server Room
This leaves us with our measured IT load and current overhead; plug those numbers into calculator above, and it does math for you. No need to convert or try to figure out what coefficient to use; it’s all taken care of. You’ll find that the base number, your measured IT equipment load (is most important).
Are you running an enormous two-thousand-watt GPU cluster? Your overhead costs is going to be more significant, in absolute terms, then if you’re running a single forty watt four-bay NAS. Regardless, the percentage of waste will remain constant. Remember, a crappy PUE means you’re paying for air conditioning to power the lights…which is precisely why we measure it in the first place.
What is efficiency? Most folks think it’s about purchasing higher efficiency equipment. Usually, it’s about airflow management. Hot air rises and flows back into intake side of your rack, which decreases the efficiency of your home server. See this page, which shows how much extra cost builds up for each level of PUE (efficiency). So if you have a PUE of two point zero, you’re effectively paying for your server double.
Most people don’t realize this. They look at their server draw and believe they’re done. The cooling portion of overhead can easily be more than the rest of energy picture, especially in enclosed environments such as garages or closets where there’s no place for heat to go.
There’s also the matter of upsizing (or right-sizing) your UPS. Most people forget this lever exists. You’re not using your standard line-interactive UPS efficiently if it’s running on a low load; in fact, its efficiency will often drop below 80 percent if it’s powering just a little NAS. Plug that into the calculator and you’ll see percentage of energy that’s being lost during conversion as heat before it gets to your devices.
Get a correctly-sized double-conversion UPS, or enable its eco-mode setting, and you can knock off a few percentage points from your overhead. That might not sound like much but every bit helps if you want to get the most efficiency possible.
The single greatest option for the home operator is consolidation. Why run three idle servers when you could consolidate them into one? Every active server or component has its own thermal load; every active component increase your cooling need. The calculator allows you to model the effect of reducing this overhead.
You’re not only saving power of the additional hardware, but also the power needed to cool the heat generated by that hardware. This creates compound savings that scale rapidy.
This is the most difficult piece: measuring accurately. For example, how do you compare total energy used in the facility during the time period against IT energy consumed at the same time? If you just compare a daily average room cooling vs an hourly server spike, you’ll be way off. To help normalize those variables, it asks what percentage the cooling contributes and what run time to use as a buffer. That lets you start modeling real world scenarios instead of best case theoretical numbers.
The key here is to understand what exactly you’re measuring and that your boundaries matches up.
Don’t aim for perfect: Your goal in improving your PUE is not to become perfect; it’s to find out how your home server setup is wasting energy and stop doing that. You should of focused on this earlier.
Every watt matters: Turn off a non-functional device; don’t leave open rack units so they mix hot and cold air. Ensure that every kilowatt-hour you are paying for does some sort of useful work rather than just making your closet cozy.
Start with the obvious: Consolidate, improve your airflow (i.e., don’t leave rack units open), and then focus on the power supplies. You’ll see the cost-savings result, and your efficiency story will sound sensible.
You’ll find that it works better than expected based off previous attempts.