RAID 10 Rebuild Time Calculator
Estimate RAID 10 mirror-pair rebuild duration, copy-only data volume, source disk load, parallel mirror rebuilds, usable capacity, and pair-level risk during recovery.
Calculation Breakdown
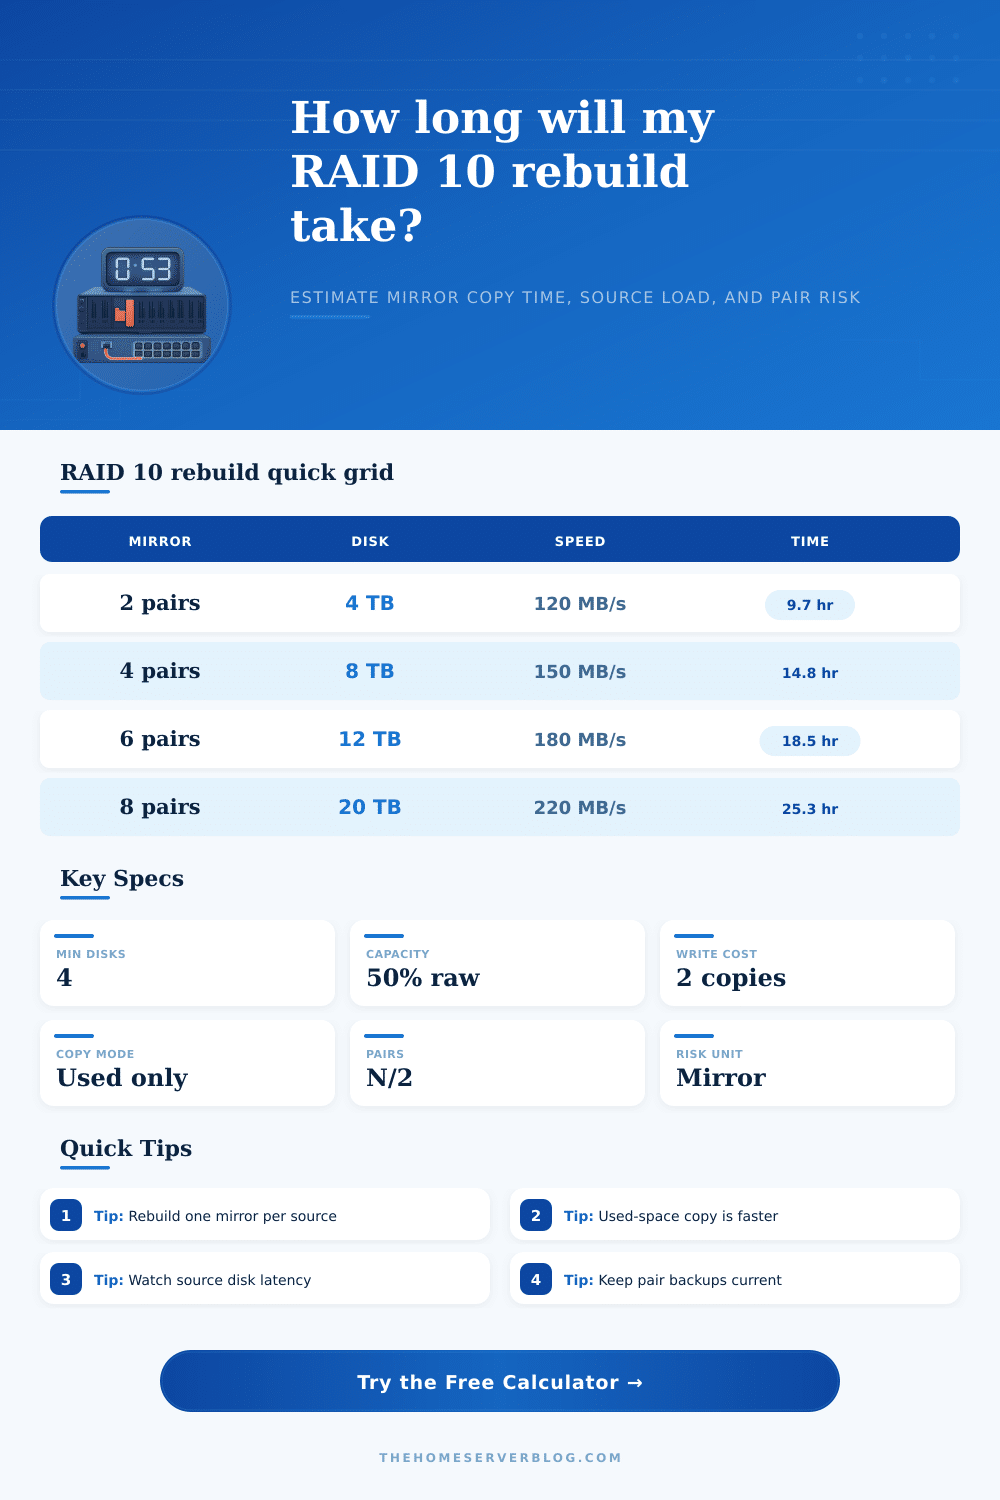
| Disk Size | Used Data | Copy Speed | Copy Volume | Single Mirror Time |
|---|---|---|---|---|
| 4 TB HDD | 70% | 120 MB/s | 2.8 TB | About 6.8 hours before verify and throttle |
| 8 TB HDD | 75% | 150 MB/s | 6.0 TB | About 11.1 hours before verify and throttle |
| 12 TB HDD | 80% | 180 MB/s | 9.6 TB | About 14.8 hours before verify and throttle |
| 20 TB HDD | 85% | 220 MB/s | 17.0 TB | About 21.5 hours before verify and throttle |
| 4 TB SATA SSD | 80% | 480 MB/s | 3.2 TB | About 1.9 hours before verify and throttle |
| Condition | RAID 10 Meaning | Risk by Pair | Planning Response | Calculator Setting |
|---|---|---|---|---|
| One failed disk | One mirror pair is degraded | Only that pair has no duplicate copy | Rebuild promptly and watch source disk errors | Failed disks = 1 |
| Two failed disks, separate pairs | Array can remain online | Two independent degraded pairs | Parallel rebuild may help if IO can handle it | Parallel rebuilds = 2 |
| Two failed disks, same pair | Data loss for that mirror pair | Stripe loses required data blocks | Restore from backup or replicas | Risk multiplier high |
| Same-batch drives | Correlated age and workload | Higher source failure chance | Scrub first if possible and keep backups current | 1.4x risk |
| SMART or media errors | Surviving partner is suspect | Critical degraded pair | Lower load, avoid extra writes, verify backup | 1.8x to 2.4x |
| Drive Class | Typical Copy Range | Best Rebuild Behavior | Watch Item | Home Server Fit |
|---|---|---|---|---|
| Archive HDD | 90-140 MB/s | Good for cold data with low traffic | SMR and sustained write cliffs | Backup and media shelves |
| 7200 RPM NAS HDD | 130-210 MB/s | Balanced copy speed and endurance | Random IO during rebuild | General NAS and file shares |
| Enterprise HDD | 170-260 MB/s | Better sustained service under load | Age and vibration in dense bays | VM lab and active shares |
| SATA SSD | 350-520 MB/s | Fast mirror copy with low latency | Write endurance and thermal limits | VM datastore and app pools |
| PCIe NVMe SSD | 1200-5000 MB/s | Very short rebuild windows | Thermal throttling and PCIe lanes | High-speed lab storage |
| Parallel Mirrors | Required Failed Pairs | Source Disk Load | Wall-Clock Effect | Use When |
|---|---|---|---|---|
| 1 mirror | One degraded pair | Concentrated on one source disk | Baseline rebuild window | Most home NAS rebuilds |
| 2 mirrors | Two separate degraded pairs | Two source disks read heavily | Can nearly halve total time | Controller and workload have headroom |
| 3-4 mirrors | Several separate degraded pairs | Backplane and CPU may become limit | Speedup depends on shared bottlenecks | Large shelves with low user traffic |
| More than 4 | Wide RAID 10 with many failures | Heavy array-wide service impact | Often limited by controller policy | Maintenance windows only |
RAID 10 is redundancy, not backup. This calculator estimates rebuild mechanics and pair exposure, but it does not protect against deletion, controller faults, ransomware, filesystem damage, or a second failure in the same mirror pair.
Then you get up and go check on your disks. One has died. Not a problem, since RAID 10 write each set of data twice (mirroring pairs), there are still two copy, albeit with the remaining member of the dead pair now carrying full load while you wait for the rebuild to finish. You’re relieved, RAID 10 seem so solid!
Then you remember: it’s a house of cards built on passing minutes. Every minute your new disk stay empty, you create a window where something else could go wrong and bring whole thing crashing down. That dread of the ticking clock is what makes most admins freak out when recovering from rather then plan for disasters.
Why RAID Rebuild Takes Time
Rebuilding doesn’t return data immediately. Rebuilding is a heavy data task competing for resources against your workloads. Plug specs of your drives into calculator above and it does the math for you, no guessing about whether your controller can handle it. Not only does it estimate the wall-clock time required, but what’s even more important, it estimates load on the source disk.
Because if you can afford to do a slow rebuild, the server stay responsive; whereas doing a fast rebuild risks overheating the remaining drive or choking your day-to-day workloads. Speed vs. Stability, pick one.
The biggest lever you can pull to speed things up is copy mode. Copy-only rebuilds are common with moddern file systems and ZFS implementations, it doesn’t have to scrub all gigabytes on the disk surface; just copy what has actual data (which is usually around 40% of the drive for most people). So if your drives is forty percent full, copying only the used blocks cuts the time nearly in half compared to a full surface scan.
Because of this, the calculator let you select copy mode and input how much of the volume is already used. In other words, it’s a simple toggle that takes into account how advanced your storage software is. But if you happen to be running something old-school that doesn’t track blocks or have any kind of awareness of trim, you’ll probably end up copying zeros along with your files, making it take longer then it needs to.
Another shortcut is to do parallel rebuilds, which carries its own high tax. On paper, rebuilding both of the mirrors concurrently sounds efficient; you halve the cumulative waiting time. But in practice, you double the read load on whatever disks happens to be your source drives in those mirror pairs. Those may already be busy serving an active database or some set of virtual machines. Adding their workload to handle parallel rebuild traffic could lead to spikes in latency that make system unusable for everyone else.
That’s what the tool visualizes: It shows you how much each disk is being loaded so you can see the trade-off. Maybe running two mirrors in parallel will push the source disk to ninety-five percent use. That’s typically a bad idea unless you’re doing it during some sort of offline maintenance window. Take some time to think about your risk level here.
RAID 10 loses its tolerance if two disks in the same mirror pair fail. In that case, RAID 10 can no longer handle it. If your drives are from the same manufacturing batch, they tend to be around the same age and stress profile. There’s an increased chance that their partners will also die shortly after. The calculator use a multiplier for this correlation.
The high-risk setting won’t affect rebuild speed. It will only serve as a harsh reminder to double check your backups elsewhere. Note that RAID does not guard against multiple failures, corrupt data, or user error, either. It guards against hardware death.
Last but not least: what class of drive are you considering? While SSDs bring their own issues around endurance and temperature, they also rebuild within minutes compared to hours for a hard disk. If your controller cannot adequately handle the heat, pushing a drive too fast (for copying) may cause it to throttle. Dense bays also present physical limitations; hard drives suffers from both mechanical limits and vibration.
Setting realistic expectations for your build is supported by reference tables that come bundled with the tool. No matter how nice your controller is or how much you pay, a four TB SSD setup will rebuild faster than a forty TB hard drive array. Every time, planning wins over reacting.
Having this kind of control means you can plan for downtime. You can stop unnecessary backups and have spare parts at hand, all before the event happens. Because disk failure is by nature random, you won’t get rid of the fear. But removing the guessing game about what’s happening helps.
You will know exactly when the last drive spin up to start replicating and how long until the mirror is fully rebuilt. That makes a scary outage manageable as a part of planned maintenance.