HomeServerBlog storage planning tool
Storage Tiering Ratio Calculator
Estimate SSD-to-HDD balance, hot data fit, warm spillover, cold capacity, cache hit probability, promotion pressure, and growth headroom for NAS, Proxmox, ZFS, Unraid, backup, NVR, and object storage pools.
1Tiering presets
2Data and tier inputs
Tiering breakdown
Cache and pressure checks
3Media comparison grid
4Tiering reference tables
| Workload | Hot data | Warm data | Cold data |
|---|---|---|---|
| Media NAS | 5-15% | 15-30% | 55-80% |
| VM datastore | 20-45% | 25-45% | 10-35% |
| Backup target | 2-10% | 10-25% | 65-88% |
| NVR archive | 3-12% | 10-25% | 65-87% |
| Database lab | 35-70% | 15-35% | 0-25% |
The calculator normalizes the three entered percentages, so 20/30/50 and 2/3/5 model the same starting ratio.
| Window | SSD pressure | Best fit | Watch item |
|---|---|---|---|
| 1-3 days | High | Fast changing VMs | Churn and writes |
| 4-14 days | Moderate | General NAS cache | Warm spillover |
| 15-45 days | Lower | Project files | Stale hot data |
| 46-180 days | Low | Archive indexes | Over-promoting |
A shorter window can improve freshness but may keep more short-lived data on SSD during import or rebuild periods.
| Target | SSD ratio cue | Experience | Good for |
|---|---|---|---|
| 60-75% | Hot only | Capacity first | Media and backup |
| 76-88% | Hot plus some warm | Balanced | Family NAS |
| 89-95% | Hot plus warm | Responsive | VMs and photos |
| 96-99% | Large SSD tier | Flash-heavy | Database lab |
The hit estimate is based on read skew and data placement. Writes, metadata, and prefetch behavior can shift real results.
| Method | SSD role | Capacity role | Planning note |
|---|---|---|---|
| Manual datasets | Hot shares | Cold shares | Simple and predictable. |
| Read cache | Frequent blocks | Source of truth | Hit rate depends on RAM and churn. |
| Write cache | Landing zone | Destage pool | Needs power-loss protection. |
| Auto-tiering | Promoted data | Demoted data | Window and thresholds matter. |
| Metadata special | Metadata and small IO | Bulk data | Great for many small files. |
The safest design keeps irreplaceable data protected on both tiers or treats the SSD tier as rebuildable cache.
5Two tiering tips
It all starts with an external hard drive, then another, and another. And suddenly you’re running a mini datacenter out of your closet because your game collection no longer fit on your laptop. And then someone shares a 4K movie.
The challenge isn’t that you need more storage. The challenge is that you need the right storage, specifically, the right storage for the right kinds of data. Enter tiering.
Why You Need Storage Tiering
If you run virtual machines (VMs), you don’t want them stored on slower spinning platters; but you also don’t want your priciest NVMe drives clogged up with old backup archive you haven’t accessed in years. Balancing those layers are a surprisingly simple equation … but nobody gets it right. Why? They guess.
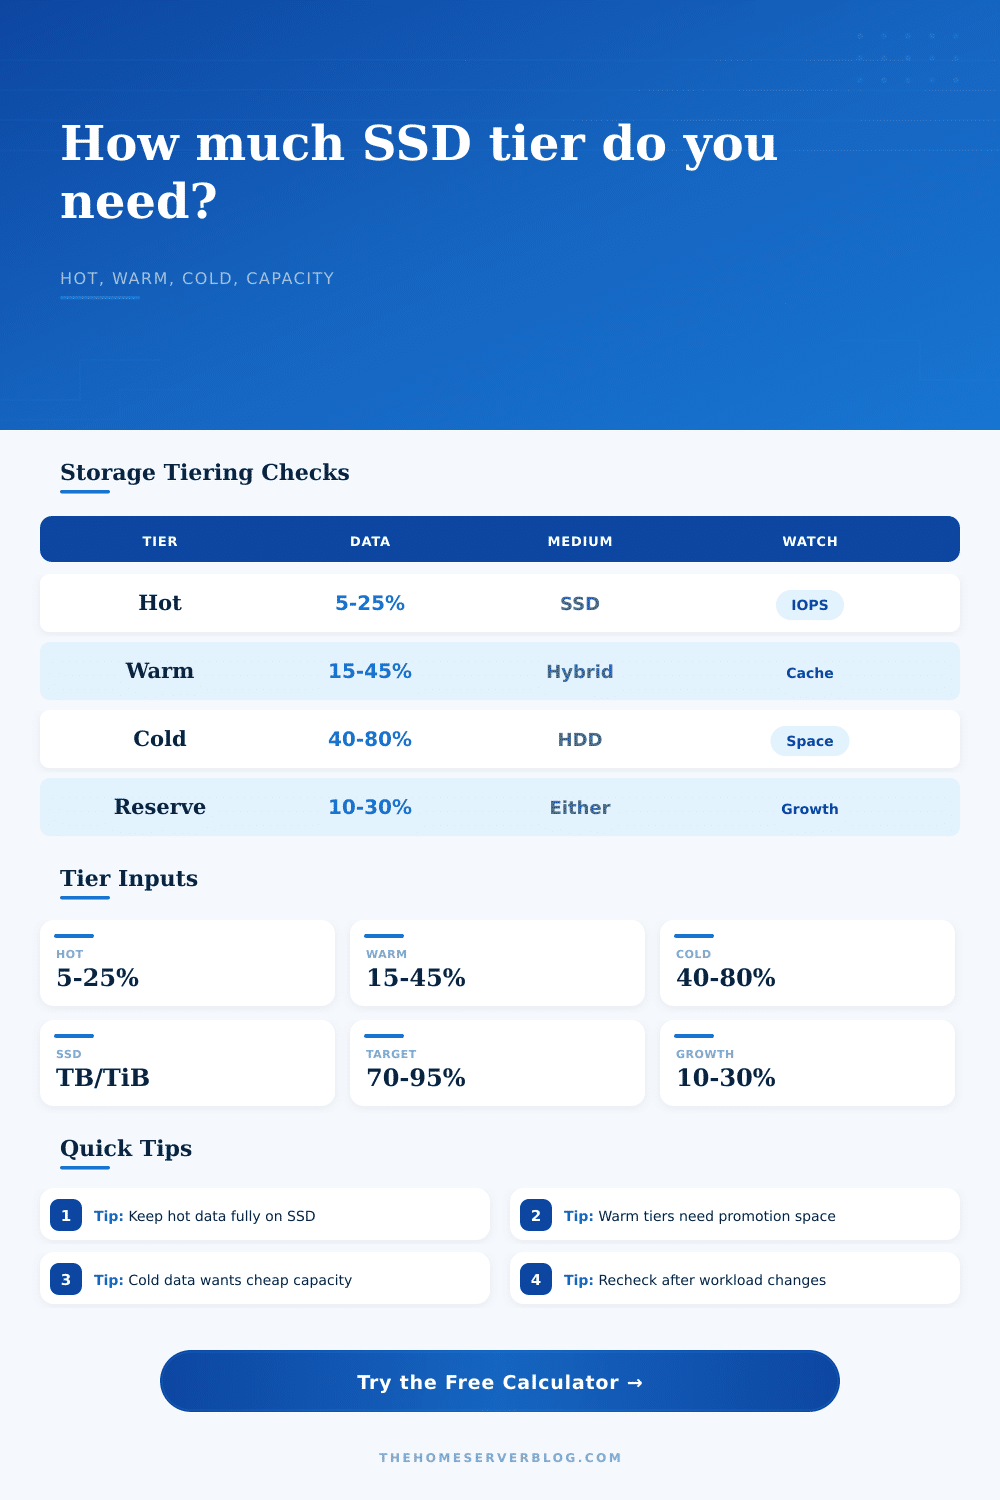
It’s all about dividing your data into three layer: hot, warm, and cold. Your hot data is the stuff you touch daily (media you’re viewing in real-time), currently running VMs, active project files. Warm data is stuff you occasionally access. Maybe it’s a game you play once a month or a photo from last summer. Cold data is everything else. These includes long-term backups, old video archive for a season, and your old tax documents.
The idea is to keep your hot layer fast, and your cold layer cheap. When you need speed, it feels sluggish; when you need capacity, it costs too much. Mixing them together randomly create a system that waste money when you need capacity. It also feels sluggish when you need speed.
How much should you store on SSD? That’s something you should of use math to figure out based off the relative sizes of your datasets in each category, rather than just guessing. For example, only fifteen percent of a media NAS’ total data is likely to be hot. Everything else lives in the warm or cold tiers since you’ll only watch a portion of your library at a time. Conversely, a database lab might have seventy percent of its data in the hot tier: You’re actively querying all of that dataset.
Once you’ve plugged those numbers into the chart above (along with your dataset size), the tool do the math for you. Does your SSD tier contain just enough data to hold your working set, without overflowing into slower storage? If no, you’ll experience lag. If yes, you’re paying for flash that you don’t need.
And then there’s the issue of promotion. Today, data is moved dynamically into tiered systems. Popular files gets promoted to the SSD tier and forgotten ones demoted back to HDDs. How fast that happens are important. A small promotion window will keep your cache fresh, it causes some write pressure on the SSDs, though. A large one decreases wear on the SSDs, but increases the chance you’ll serve stale data pulled from slow tier. You need to find the right window based on how you use the server. Do you archive security footage? Then maybe a thirty day window make sense. Are you running a dev server? Maybe three days is better.
This matches your cache hit targets in the calculator. Ninety percent is a good target for most home servers, which means nine out of ten of your reads originate from the fast tier. Anything above that give you diminishing returns with exponentially more SSD capacity.
Remember to account for expansion. Storage isn’t static; it grows over time. You back up more data. You create more VM snapshots. Your photo library grows. Filling your HDD tier to capacity turns off the tiering engine. It can’t demote any of that older stuff so the hot tier fills up and everything grind to a halt.
Twenty percent is a reasonable buffer; leave space for storage to breathe when it needs to (e.g. This happens during large imports or index rebuilds. On the page are some common presets for different types of workload laid out in the reference tables. These aren’t rules; they’re a place to start. You’ll use things differntly in practice.
The idea here is that you no longer treat storage as one big bucket. If you divide up your data according to how you use it, then you can enjoy the performance of an all-flash server without the associated price tag.