Home Lab Storage Planning
Replication Factor Storage Calculator
Estimate raw disk capacity, protected usable storage, reserved free space, growth buffer, and repair traffic for mirrored NAS pools, Ceph, MinIO, Longhorn, Gluster, and other replicated storage layouts.
⚡Real Storage Presets
⚙Storage Inputs
Calculation Breakdown
Fit and Balance
🗄Equipment and Spec Comparison
About 50% of raw capacity before reserve and metadata.
About 33% of raw capacity, common for small Ceph and Longhorn pools.
Often used when recovery, snapshots, or uneven nodes need breathing room.
A 3x replicated object can lose two copies only when placement is healthy.
CMR NAS HDD
Good for media, backups, and object storage where capacity is more important than latency.
8-12 WTypical active draw per disk, with 180-285 MB/s sequential transfer.
Enterprise HDD
Best for dense shelves and large home lab object pools with predictable rebuild behavior.
16-20 TiBCommon OS-reported capacity range for 18-22 TB label drives.
SATA SSD
Useful for VM datastores, small databases, and metadata-heavy replicated volumes.
1-3 DWPDEndurance class matters when every logical write becomes multiple replica writes.
NVMe SSD
High repair speed and low latency, but network links can become the actual bottleneck.
3+ GB/sLocal sequential performance usually exceeds 10 GbE transfer capacity.
📊Reference Tables
Replication Factor Capacity
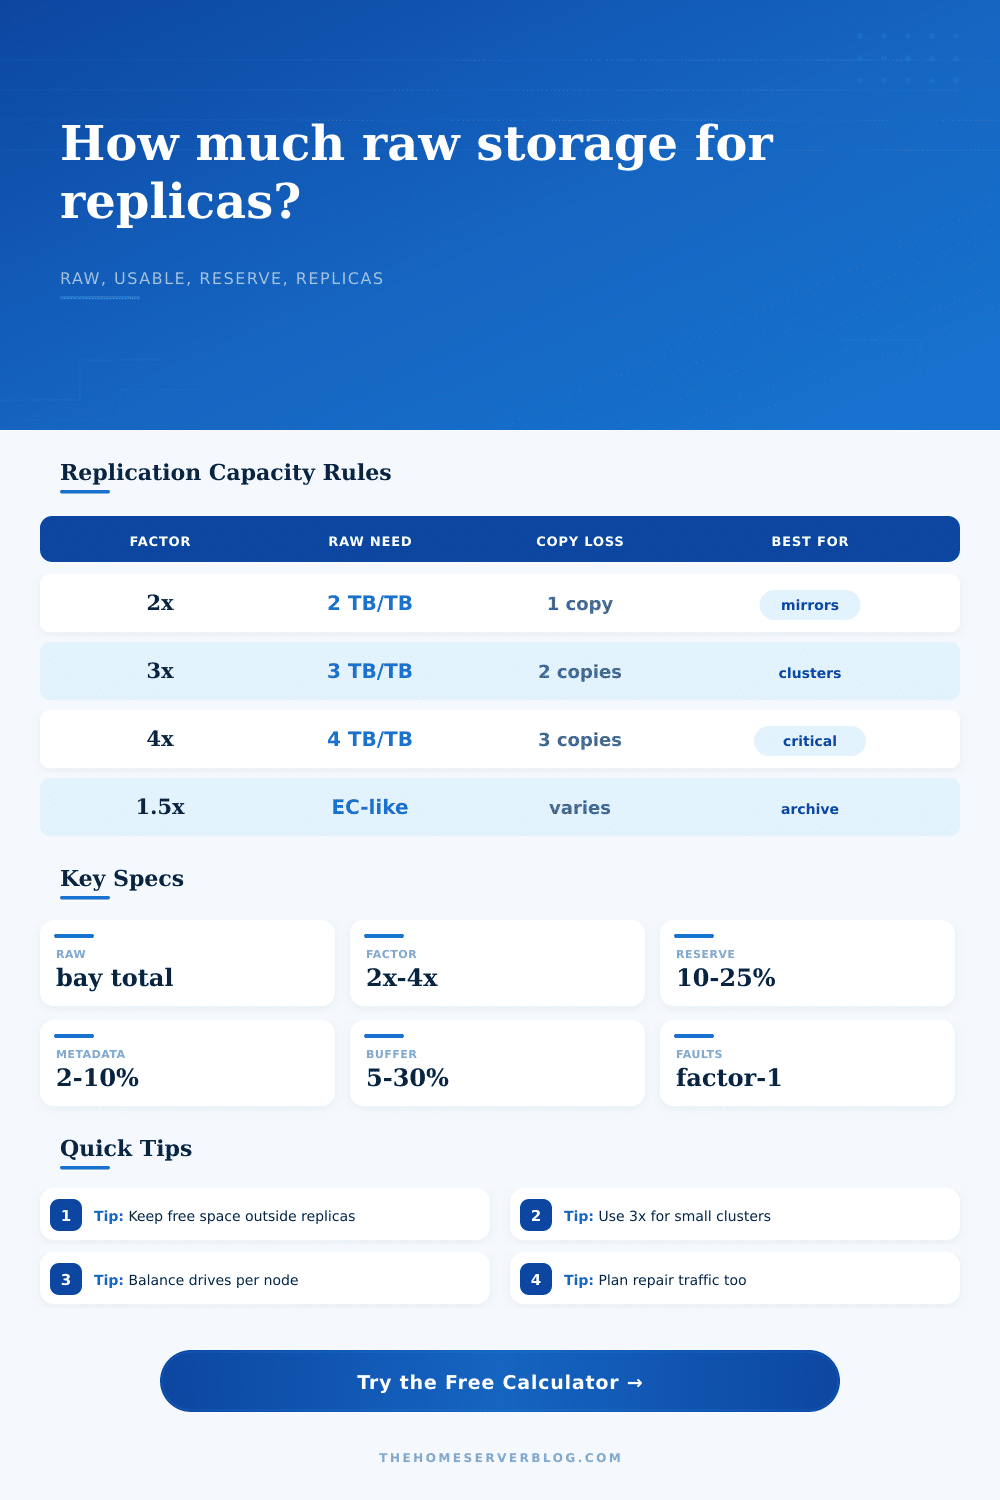
| Replication | Raw Needed Per 1 TiB Logical | Ideal Raw Efficiency | Typical Use |
|---|---|---|---|
| 1x | 1 TiB | 100% before overhead | Scratch space, cache, noncritical data |
| 2x | 2 TiB | 50% before overhead | Mirrors, small NAS, backup copies |
| 3x | 3 TiB | 33.3% before overhead | Ceph, Longhorn, small reliable clusters |
| 4x | 4 TiB | 25% before overhead | Critical objects or high availability labs |
Drive Label to Usable Capacity
| Label Capacity | Approx TiB | 2x Before Reserve | 3x Before Reserve |
|---|---|---|---|
| 8 TB | 7.28 TiB | 3.64 TiB | 2.43 TiB |
| 12 TB | 10.91 TiB | 5.46 TiB | 3.64 TiB |
| 18 TB | 16.37 TiB | 8.19 TiB | 5.46 TiB |
| 22 TB | 20.01 TiB | 10.00 TiB | 6.67 TiB |
Storage Type Planning Values
| Media Class | Sequential Repair Rate | Active Power | Planning Note |
|---|---|---|---|
| 8 TB NAS HDD | 180 MB/s | 7 W | Lower capacity, manageable repair windows |
| 18 TB Enterprise HDD | 250 MB/s | 8 W | Dense but long repairs if heavily filled |
| 7.68 TB SATA SSD | 520 MB/s | 5 W | Good for VM replicas and metadata |
| 15.36 TB NVMe SSD | 3200 MB/s | 12 W | Network and CPU may cap rebuild speed |
Common Replicated Project Sizes
| Project | Example Layout | Replication | Practical Reserve |
|---|---|---|---|
| Home NAS mirror | 1 node x 2 drives | 2x | 10-15% free raw |
| Mini Ceph lab | 3 nodes x 2 drives | 3x | 20-25% free raw |
| VM SSD pool | 4 nodes x 2 SSDs | 3x | 15-20% plus snapshots |
| Object archive | 4-6 nodes x 4+ drives | 2x or 3x | 15-25% for rebalancing |
💡Planning Notes
The formulas here model capacity planning, not application availability. Real systems also depend on placement rules, drive health, network bandwidth, scrub schedules, and whether snapshots or deleted-object retention share the same pool.
“Replication costs you space in your array, it’s a tax you pay yourself to purchase insurance for your own equipment.” You can think of it as building a cluster of storage and wasting some of that space. The idea is to balance raw capacity with usable space after protection. You must also account for buffer space and the extra space required for storing meta-data. That’s what the calculator figures out, and it’s far from simple math. It’s a trade-off between efficiency and safety.
The usual beginning is: “how big do I need to be? How many terabytes?” Trap. You’re not realy buying raw capacity; you’re buying capacity that will survive when a drive dies in the middle of the night.
Why Your Storage Space Is Smaller Than You Think
One way to handle this is replication (copying data onto multiple drives). Set it at two, and you get a mirror and waste half your available disk on duplication. Go for three, and you have two spare copies and waste two-thirds of your available disk. The tool graphically shows these tradeoffs: how much raw disk you need to buy to get the actual amount of storage you want.
The catch: Where do those copies go? They don’t go into an already-full pool. Filling a replicated pool to capacity is a sure way to cause a cluster-wide outage. If a drive fails, the system needs to copy its contents over to a new one. With no empty storage, it’s stuck. To take that into account, the calculator allows you to specify a percentage to be reserved. A 15- to 20-percent reserve provides some cushioning in case drives becomes worn or snapshotted unevenly. It is a small detail, but it is important. No reserve means a single disk failure cascades into a cluster-wide outage as the system simply runs out of storage to use to recover from the problem.
The other silent thief is metadata. Every filesystem require some amount of space to maintain allocation tables, journals, and maps. This overhead consumes a portion of your capacity before you write any user data at all. You can account for this with the tool, because it knows, for instance, that an object store differ from a VM datastore in terms of overhead. Fail to account for metadata, and your usable capacity will always be lower than expected. That’s what folks mess up. They purchase their drive by its label capacity, forgetting the operating system will see less then advertised.
Replication also creates some unseen costs: repair traffic. The cluster has to copy data back to take the place of a failed drive. That puts strain on other drives as well as the network. Your fill level determines how much load the calculator assigns here. Run your pool at 90 percent capacity, then one of those drives goes kaput, now the system has to shuffle all that data around for the rebuild. Everything grinds to a halt. Better to be slightly underfilled than to gamble with a lengthy repair window. Math time helps you see that sweet spot between just enough space and too much waste.
The equation also includes drive choice. For example, enterprise hard drives is high-density, but take longer to repair. SSDs are fast-rebuilding but higher-cost-per-terabyte. How do they compare? The page has some reference tables that show you the trade-offs between media class and repair speed vs power. There is no “one size fits all,” only a balancing act of speed, density, and cost.
Storage planning is an exercise in embracing inefficiency. You’ll never reach perfect efficiency with your raw hardware. Accept that fact; that’s the cost of reliability. Your aim isn’t to avoid waste, but rather to intelligently control it. Use growth buffers, replication factors, and reserve adjustments to create a system where failure is survivable without being too costly. The math tells you how far to push, but the decision is up to you. You should of checked the math first. Embrace the empty space. It’s a feature, not a bug. It’s the margin that saves your bacon when the chips are down.