HomeServerBlog virtualization capacity planner
vCPU to pCPU Ratio Calculator
Estimate virtual CPU density for a home lab or small virtualization cluster by combining physical cores, SMT credit, reserved host cores, workload behavior, peak demand, scheduler overhead, buffer, and failover policy.
▣Virtualization presets
⚙Host, cluster, and VM inputs
Calculation breakdown
Capacity status
📊Live sizing snapshot
Physical cores plus partial SMT credit, less host reservations.
VM count multiplied by average vCPU, plus pinned appliances.
Assigned vCPU multiplied by peak demand and workload burst factor.
Recommended capacity minus currently assigned vCPU.
🖧Equipment and platform comparison grid
Efficient mini PC cores, best for light services and small VM counts.
Strong single-threaded lab host for mixed VMs and interactive tools.
High desktop throughput with good SMT behavior for home clusters.
Older dual-socket hosts offer many cores but lower per-core speed.
Balanced server platform with NUMA awareness and steady scheduling.
Dense home lab platform with strong core count and memory bandwidth.
Low-power embedded server class, useful when guests are mostly idle.
Mini PC performance depends on cooling and sustained turbo behavior.
📋Reference tables
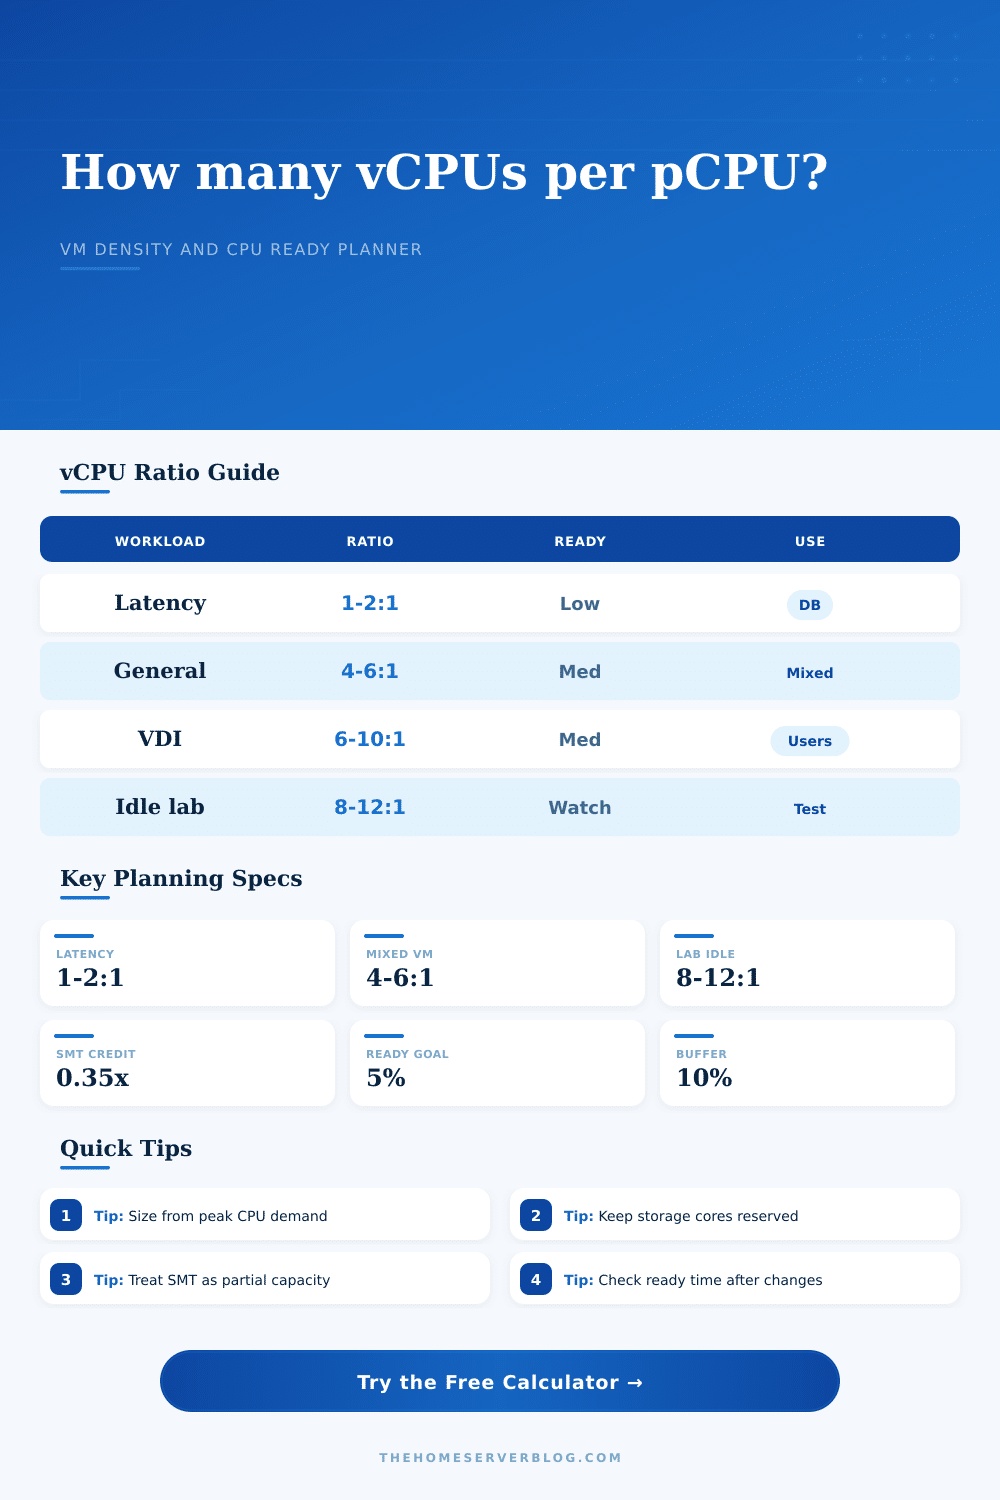
Workload ratio guide
| Workload profile | Typical safe range | CPU ready target | Planning note |
|---|---|---|---|
| Latency-sensitive firewall, voice, or database | 1:1 to 2:1 | 2% to 5% | Keep queues short and avoid scheduling delay during bursts. |
| Interactive app servers and light desktops | 2:1 to 4:1 | 5% | Works when peaks do not align across every guest. |
| General mixed home lab | 4:1 to 6:1 | 5% to 10% | Common target for DNS, media, monitoring, and utility VMs. |
| Container-heavy service host | 5:1 to 8:1 | 5% to 10% | High density is realistic if CPU limits and bursts are controlled. |
| Batch builds, test jobs, and lab automation | 6:1 to 10:1 | 10% | Acceptable when slower completion is better than idle hardware. |
| Mostly idle nested VMs and sandboxes | 8:1 to 12:1 | 10% to 15% | Watch for boot storms, patch windows, and simultaneous scans. |
CPU platform assumptions
| CPU profile | Per-core factor | SMT credit | Best fit |
|---|---|---|---|
| Intel N100 / N-series | 0.78x | 0.00x to 0.20x | Tiny Proxmox host, firewall, monitoring, and a few services. |
| Intel Core i5/i7 desktop | 1.08x | 0.35x | Fast mixed workloads where single-thread speed matters. |
| AMD Ryzen 5/7 desktop | 1.12x | 0.35x | Dense home VM host with good all-core performance. |
| Intel Xeon E5 v3/v4 | 0.88x | 0.30x | Large memory labs and many moderate VMs. |
| Xeon Scalable Silver/Gold | 1.00x | 0.35x | Balanced server workloads with NUMA-aware placement. |
| AMD EPYC 7002/7003 | 1.15x | 0.35x | High-density labs, nested clusters, and many small VMs. |
| Atom C3000 / embedded server | 0.70x | 0.15x | Firewall, NAS helpers, and lightweight always-on services. |
| Mobile Core / mini PC | 0.92x | 0.30x | Quiet labs where cooling may limit sustained turbo clocks. |
Scheduler and cluster modifiers
| Setting | Calculator formula effect | Practical limit | Why it matters |
|---|---|---|---|
| SMT or Hyper-Threading | Extra thread capacity = physical cores x SMT credit | 0.15x to 0.35x | Sibling threads help throughput but do not equal full physical cores. |
| Reserved cores | Usable pCPU = effective pCPU - reserved cores | 0.5 to 2 cores | Storage, host networking, and backup services need CPU outside guests. |
| N+1 failover | Available hosts = host count - 1 | 3+ hosts best | Capacity must survive one host down without pushing every VM into contention. |
| Scheduler overhead | Demanded cores x (1 + overhead %) | 5% to 15% | I/O threads, emulation, and host daemons consume real CPU time. |
| Capacity buffer | Recommended vCPU x (1 - buffer %) | 10% common | Leaves room for updates, scans, backups, and short simultaneous spikes. |
Common home lab project sizes
| Project | Example host pool | Starting ratio | Secondary check |
|---|---|---|---|
| Mini always-on Proxmox box | 1 host, 4 E-cores, 6 to 10 small guests | 3:1 to 5:1 | Watch sustained CPU and thermal throttling. |
| NAS with app VMs | 1 host, 6 to 8 desktop cores | 4:1 to 6:1 | Reserve cores for ZFS, SMB, and backup tasks. |
| Three-node HA cluster | 3 hosts, 8 cores each, N+1 reserve | 4:1 to 5:1 | Check capacity with one host unavailable. |
| Nested virtualization lab | 1 EPYC or Ryzen host, many idle VMs | 8:1 to 12:1 | Boot storms can exceed steady-state assumptions. |
| Database or router VM set | 1 to 2 hosts, pinned critical guests | 1:1 to 3:1 | Prefer low ready time over maximum VM count. |
The calculator models effective CPU capacity for planning. Confirm final density with real metrics such as CPU ready, host run queue, steal time, latency, and guest performance during the busiest maintenance window.
💡Planning tips
You carefully selected each component when building it out. The RAM matched the CPU. Maybe you debated which RAID level to use for hours before you finally made a decision.
So then you boot into ESXi or Proxmox and begin spinning up your virtual machines. You might spin up a firewall here, a database there, and some home automation containers for good measure. It all feel snappy. Your hosts appear idle on the dashboard so you think you’re safe.
How to Plan Your Virtual Machine Resources
That’s where most virtualization projects go to die. Those hosts aren’t realy idle. In fact, they’re waiting. While they wait, the scheduler juggle context switches. Meanwhile, your guests waits in line for their chance to use the processor.
The key is understanding the distinction between virtual CPUs and physical processing power. Virtual CPUs are often misinterpreted as equivalent to physical cores. You look at task manager and see eight threads; so, you assume you’ve got eight cores to donate. Wrong! That will cost you latency down the line.
Hyper-Threading, or simultaneous multithreading, use shared execution resources inside a single physical core. This boosts throughput on background tasks, but doesn’t double your capacity for responsive workloads. By choosing your CPU platform, the calculator above does the math for you so you don’t need to guess what fraction of a core you should of credit each additional thread. Instead, it assigns a realistic value instead of allowing you to assume that every thread is a whole core.
So what’s your workload profile? Does it matter? Is latency important? Both a database and a firewall care about that. When someone sends them a query, or a packet comes through their firewall, they want instant access to the underlying CPU. Oversubscribe those VMs too heavily, and the guest will has to wait around in the CPU ready queue. A couple of millisecond delays here and there sum to dropped packets, or a sluggish interface later on.
But a test VM, sitting idle half the day, doesn’t much care for waiting five minutes before it runs. Pack more of those onto the same hardware.
Other inputs that trip people up include reserved cores. To get as much value as possible for density, you’d like to use all cores assigned to guests. However, remember the hypervisor require breathing room. Networking on the host, backup daemons, storage threads; they all requires CPU time. Starve the host, and everything (including VMs) will slow down.
A couple of core reserved is not a waste of space; it’s insurance. It makes sure underlying system remains healthy, preventing the guests from starving during a backup window.
Plan for your failover. When you have a cluster, how will this work if you take a node out of rotation for maintenance? How much load does it shift? The calculator accounts for that. Your load will increase on the other hosts, which means your capacity is different than what you were planning for. Run without that cushion and you can get great density numbers on paper, but not in real life. What you’re left with is a cluster that functions perfectly … right up to the point where it has to function perfectly.
And then there’s the reality check: peak demand. Sure, you may have two dozen VMs, but chances are none of them will spike at the same time. This is where oversubscription comes into play. You bank on the fact that, statistically, it is unlikely that all your machines will hit 100% CPU usage at the same time. However, what is peak? Is it a quiet Tuesday afternoon? Or maybe it is a Sunday night when everyone is backing up their photos and gaming? Define what peak means to set a realistic peak demand percentage. Give yourself some breathing room for storms that actualy occur, but do not plan for a ghost load that never occurs.
As you’ll see from the reference tables on the page, they’re nothing more than guidelines; your mileage will vary depending on scaling behavior, cooling, thermal limits, etc. The ratio may work better in some cases then others. A higher ratio may be possible with a Ryzen desktop CPU than an older Xeon due to single-core speed, but it doesn’t matter as much if your workload is completely parallel. It’s a balancing act between scheduling efficiency and raw power.
Don’t chase numbers The whole point of density isn’t density. It’s a means to an end. Your lab should be stable and respond quickly when you need it. You’ve lost the plot if you’re always tweaking things to get one more VM squeezed in. Build for your worst day, not your best. Reserve some resources on hosts. Keep the ready times down. Realize that available doesn’t mean idle.
After the dust has settled, you’ll have a system that actualy works when you turn it on.