HomeServerBlog recovery window planner
Restore Time Estimator Calculator
Estimate practical restore duration from backup source, network, target writes, decompression, catalog lookup, parallel streams, dependency order, validation work, and safety margin.
Restore time breakdown
Bottleneck and validation signals
Data movement before checks, catalog, dependency order, and margin.
Normalized restore payload used in the timing model.
Parallel lane gain after dependency and method limits.
Quick read on whether the modeled window is short or extended.
| Payload | 100 MB/s | 250 MB/s | 1 GB/s |
|---|---|---|---|
| 100 GB | 17 min | 7 min | 2 min |
| 500 GB | 1.4 hr | 34 min | 8 min |
| 2 TB | 5.6 hr | 2.2 hr | 33 min |
| 8 TB | 22 hr | 8.9 hr | 2.2 hr |
This table uses decimal units and excludes validation, lookup, ordering, retries, and safety margin.
| Path | Practical MB/s | Best Fit | Watch Item |
|---|---|---|---|
| 1 GbE LAN | 105 to 115 | small VM or files | SMB/NFS overhead |
| 2.5 GbE LAN | 250 to 285 | home NAS restore | switch buffers |
| 10 GbE LAN | 900 to 1100 | rack recovery | CPU and disks |
| WAN pull | 5 to 125 | cloud DR | provider throttle |
| USB disk | 120 to 450 | local emergency | bridge cooling |
Use measured restore throughput when possible because encryption, checksums, and agent behavior can shift real speeds.
| Validation Level | Typical Time | Use When | What It Catches |
|---|---|---|---|
| Sample files | 2 to 8 min/TB | media or archive | missing paths |
| Checksum pass | 10 to 35 min/TB | critical data | silent corruption |
| VM boot test | 10 to 45 min | image restore | boot and drivers |
| DB consistency | 20 to 90 min/TB | database restore | log replay gaps |
| App smoke test | 15 to 60 min | service stack | dependency faults |
Verification is part of usable recovery time, not an optional afterthought for important systems.
| Order Type | Stream Efficiency | Delay Add | Example |
|---|---|---|---|
| Independent | 85 to 95% | 0% | separate shares |
| Loose checkpoints | 65 to 80% | 8% | VM batch |
| Ordered services | 45 to 60% | 18% | NAS plus apps |
| Strict chain | 25 to 45% | 32% | DB then app |
Ordering penalties model the time lost when later work cannot begin until earlier services are usable.
That’s the story of every time one of your drives go south or your servers crash. You grab a cup of coffee, prepare to roll out the restore from backup plan, and start watching progress bar. At first it seems to go pretty quickly, way more so than you anticipated for about ten minutes. Then it slow to a halt, did your network die? Did it hang while trying to write to disk? Or did you just delude yourself into thinking your backup would be any good at all?
The answer: it never is as straightforward as that. There’s no such thing as “restore speed.” Instead, it’s a question of how fast you can read data off a disk versus how much data gets written back. You also has to consider how fast you can get it across the wire and whether it will take long enough to verify that what you’re pulling back is actualy usable.
Why Restoring Data Is Harder Than You Think
Link speeds and raw file sizes are how most people guess at the size of their recovery window, without accounting for all the friction that occurs between those points. The result is a two-hour restore becoming a six-hour ordeal, which puts you well outside your recovery time objective (RTO) and into panic mode.
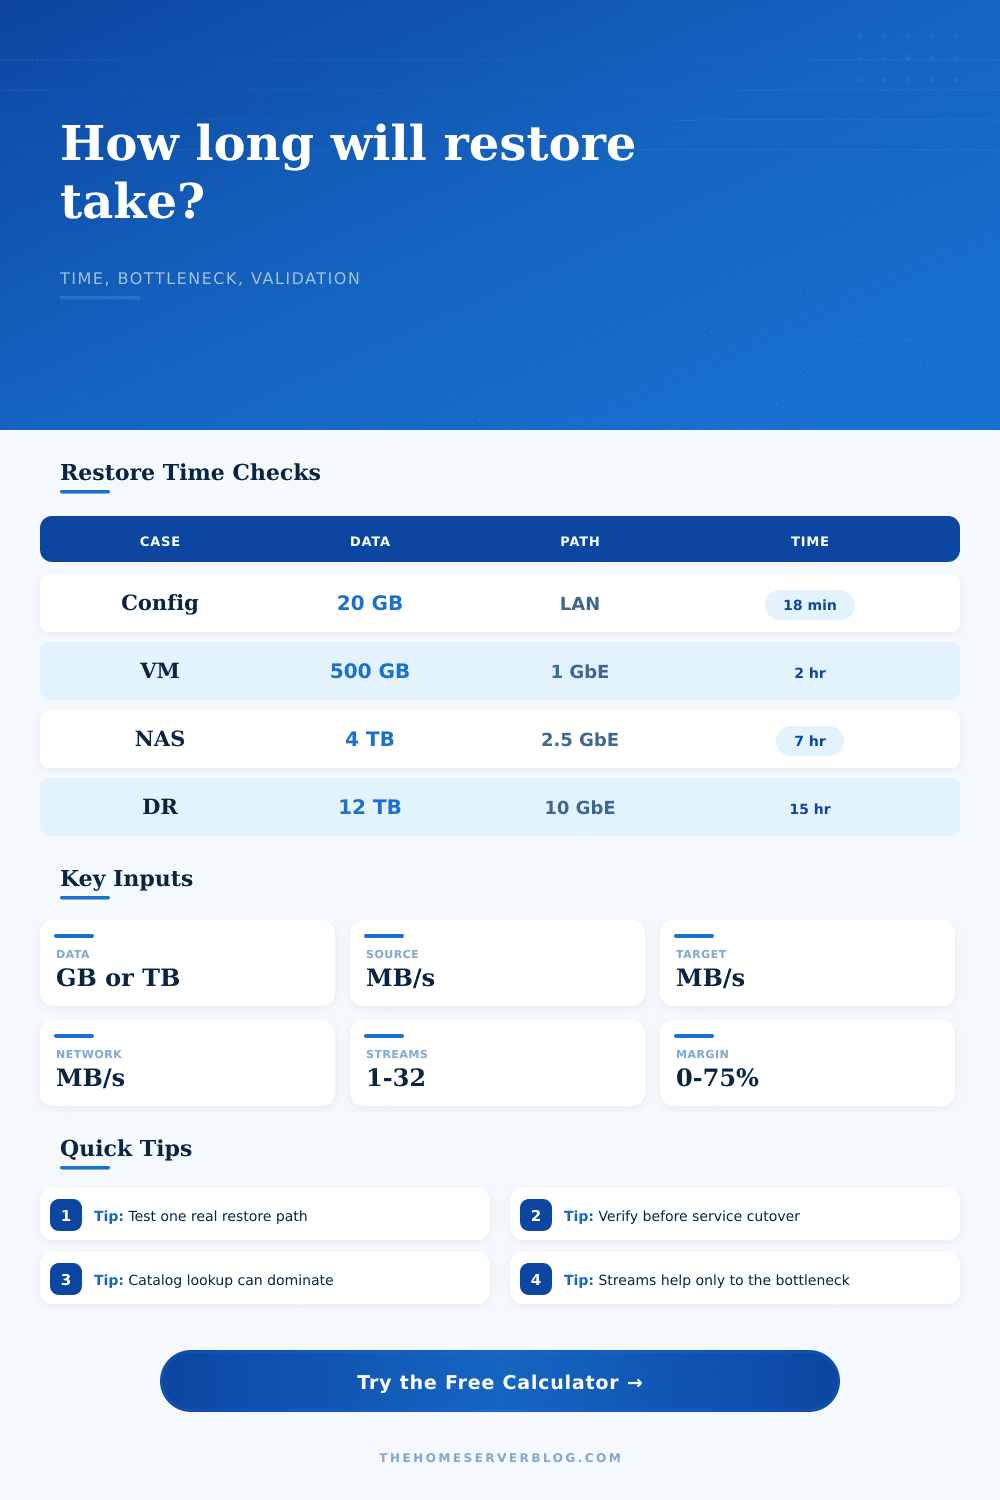
You enter your own constraints into the calculator (above) and let it do the math, but the key is knowing what each constraint means (that’s what’ll save your weekend). Your restore path is like a pipeline. How much can the source disk read? Two hundred megabytes per second. How about the network? One hundred and ten. And how fast does the target drive write? One hundred and fifty. So the network is the bottleneck. Parallel streams aren’t going to help you if your pipe’s narrow. The tool will show you where the choke point is so you don’t need it.
And it also makes you consider the catalog lookup. This is the part that most people ignore. Finding files in an index of backups take time. This is especially true if you’re talking about millions of small file. If you’ve got a photo archive with fifty thousand pictures, a lot of its restore time isn’t spent moving the files, it’s spent trying to find them.
The second problem is dependencies. Throughput is a measure of your restore path’s capacity, but what about dependencies? In order to bring up a web app, the database need to be up first; in turn, the database can’t do anything without its storage volumes being mounted. Because these things need to start in some sort of order, they serialize the recovery process. Even though you may have ten network lanes, you can only use one at a time, as each service has to come online in a particular order. To model this, the estimator puts penalties on parallel streams where there is strict ordering. This is a little thing, but makes an immense difference to service availability. Nothing works without an identity provider, so restoring that first server gets top priority, even if the rest of the rack could come online theoreticaly faster than that.
The last gatekeeper is validation. Half of the problem is copying data, but the other half is proving it’s correct: checking checksums, starting up virtual machines, running database consistency checks. For data integrity, these aren’t optional steps, but they’re frequently left out of the optimistic time estimates. Checking a handful of files can be as fast as a couple minutes per TB, but replays of entire databases may require hours.
Include a cushion in your estimated time; inevitably, something will go wrong and require a retry (or two). Or maybe a disk slows down, or you experience a delay while coordinating with another team member while you’re pressured and fatigued. Anticipate the worst case so you can recover smoothly, rather than scramble to cover yourself once things have gone sideways.
Take a glance at those reference tables on the page. You’ll notice that ordering and validation play a huge part in the overall timeline. On paper it seems like a basic file restore would be fast, until you factor in boot tests and catalog overhead that widens that window. Throw in partition and driver work for a bare metal restore, and cloud pulls will be dominated by WAN bandwidth limits different than local disk speed.
Restoring the data isn’t enough. We want the applications up and running with the service back online so the user can trust their data is there. If the restore completes but the app doesn’t start or the data turns out to be corrupt, then you haven’t restored anything.
Periodically test your restore path. Don’t do it in a lab, measure it on your actual environment. It is the slowest stage there. Include your validation steps within your defined recovery window. Plan for the bottleneck, not the bandwidth. There won’t be any time to waste wondering where the delay is coming from when the disk drops out. You’ll only have the time you planned for. That plan should of accounted for the reality of your infrastucture, not the best-case scenario.