HomeServerBlog disaster recovery planner
RPO RTO Gap Calculator
Compare backup cadence, replica lag, detection, manual response, failover, restore, validation, and change rate against RPO and RTO objectives for NAS, VM, database, SaaS export, and warm-standby disaster recovery plans.
1DR presets
2Recovery objective inputs
Calculation breakdown
Objective fit
3DR objective snapshot
Minutes beyond the data-loss objective.
Minutes beyond the service-restoration objective.
Change-rate volume if a full day is exposed.
Largest single time component in the plan.
4Recovery method grid
Snapshot restore
Good for NAS shares, VM disks, and file servers where point-in-time rollback is available.
RPO: minutes-hoursWatch restore speed and snapshot integrity.Warm replica
Useful when a second host, NAS, or cloud target can be promoted after health checks.
RPO: lag windowWatch split-brain controls and DNS.Automated HA
Best for clustered virtualization and network services that can fail over without a manual restore.
RTO: minutesWatch quorum, fencing, and shared risk.Database PITR
Fits databases with base backups and logs that can replay to a known safe point.
RPO: log delayWatch corruption detection and replay time.SaaS export
Works for cloud apps when exports, API dumps, and identity backups are the fallback path.
RPO: export ageWatch import limits and attachment gaps.Image restore
Useful for bootable systems where full images can rebuild a host or VM from backup storage.
RTO: copy boundWatch boot drivers and network paths.Cold archive
Appropriate for rarely changed records, old media, and compliance copies kept offline.
RTO: many hoursWatch inventory and retrieval steps.Active active
Fits critical services with independent sites, live traffic steering, and tested consistency rules.
RPO: near zeroWatch application state conflicts.5DR objective tables
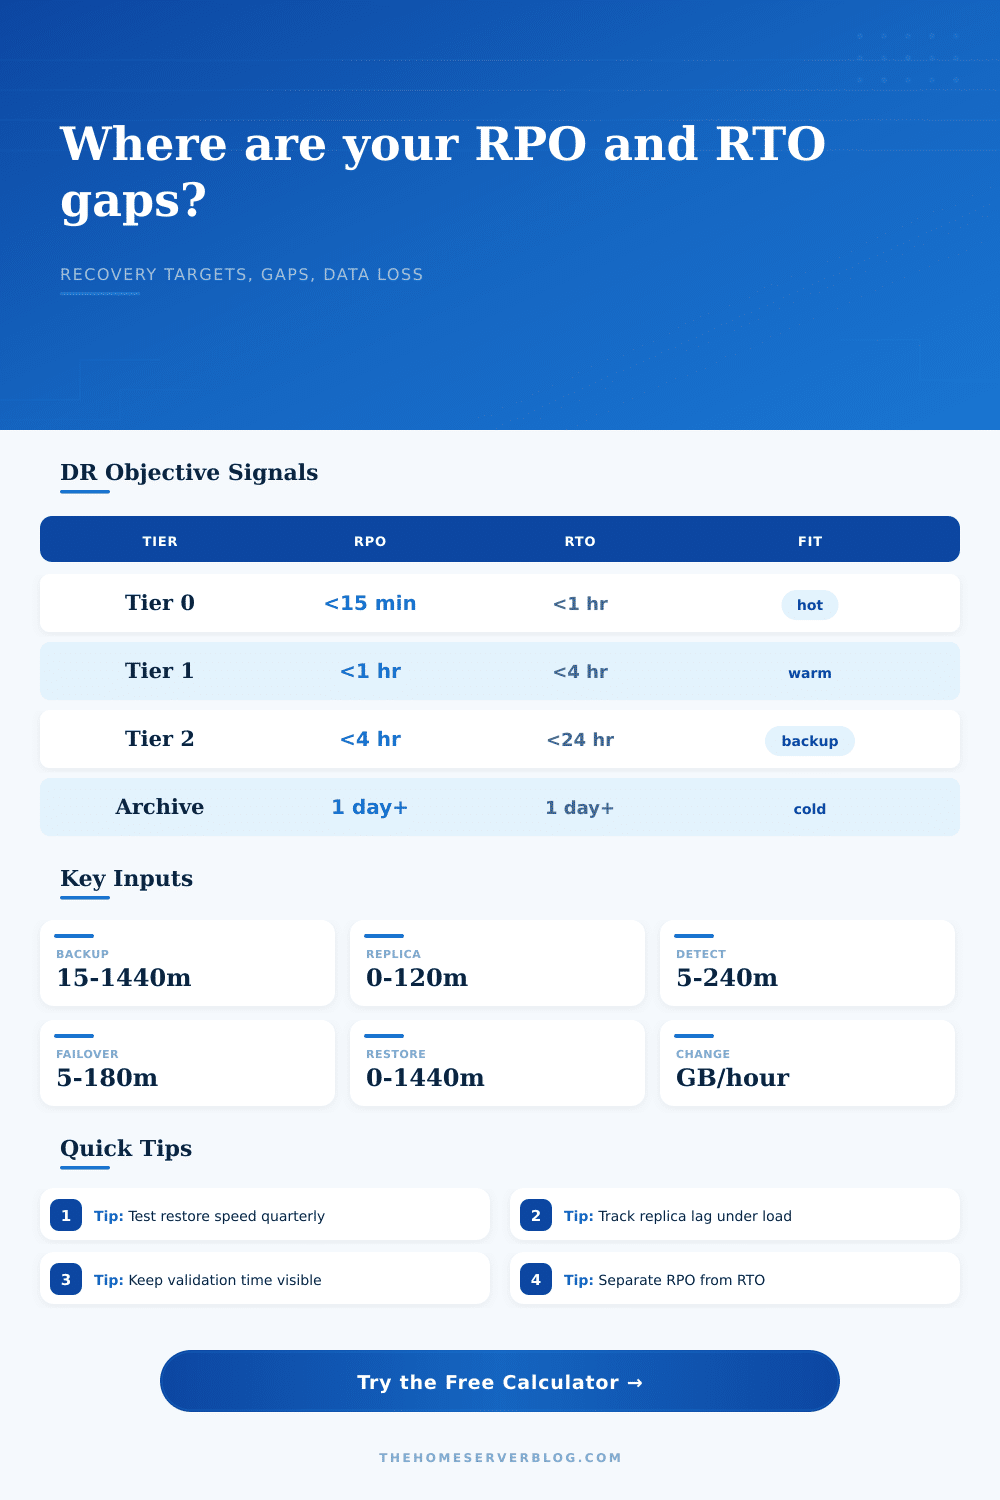
Objective tier table
| Tier | Target RPO | Target RTO | Typical fit |
|---|---|---|---|
| Tier 0 | 0 to 15 minutes | Less than 1 hour | Active-active apps, clustered databases, transaction systems |
| Tier 1 | 15 to 60 minutes | 1 to 4 hours | Warm replicas, frequent snapshots, hypervisor recovery |
| Tier 2 | 1 to 4 hours | 4 to 24 hours | Most home lab services, NAS shares, media metadata |
| Archive | 1 day or more | 1 day or more | Cold storage, offline media, retained records |
Time component impact table
| Component | Hits RPO | Hits RTO | Fastest lever |
|---|---|---|---|
| Backup interval | Yes | No | More snapshots or incremental jobs |
| Replication lag | Yes | No | More bandwidth, smaller batches, log shipping |
| Detection time | Yes | Yes | Monitoring, alerts, synthetic checks |
| Manual delay | No | Yes | Runbooks, access, delegated approval |
| Restore and validation | No | Yes | Staging restores and smoke tests |
Change-rate exposure table
| Change rate | 1 hour RPO | 4 hour RPO | 24 hour RPO |
|---|---|---|---|
| 1 GB/hour | 1 GB | 4 GB | 24 GB |
| 10 GB/hour | 10 GB | 40 GB | 240 GB |
| 100 GB/hour | 100 GB | 400 GB | 2400 GB |
| 1 TB/hour | 1000 GB | 4000 GB | 24000 GB |
Plan tuning table
| Gap pattern | Likely cause | Primary fix | Validation test |
|---|---|---|---|
| RPO only | Backup or lag too large | Shorter jobs or replica tuning | Check restore point age |
| RTO only | Restore path too slow | Pre-stage images or automate failover | Run a timed restore |
| Both gaps | Manual process plus old data | Warm standby and monitoring | Run a full DR exercise |
| No gap | Target is currently met | Keep evidence and retest | Document measured results |
The calculator compares modeled windows to targets; measured restore drills should replace estimates whenever they are available.
6Planning tips
When you’re building a disaster recovery plan, it’s easy to feel abstract anxiety. You write down how much downtime and data loss is acceptable. And then you figure that technology has got your back. But most plans fall apart at this point.
In reality, it never is really about the backup. It’s about all of the invisible delays that is built up as you attempt to repair a broken system. It takes time to detect. Time to get approval. Heck, the actual restore process surely take some time. Add them together. Far too many times, you discover your actual recovery window is double what your backup schedule says it should be.
Why Your Recovery Plan Takes Longer Than You Think
Once you define your particular set of constraints, the calculator (above) does all the math for you; saving you from having to guess about how this stuff work together. First, you enter what your service level agreement goals are: how much downtime and data loss can you tolerate? Those is your commitments to your business stakeholders or end-users. Next, you define the physical limits of your infrastructure. How often do backups run? How long does it take to replicate to your warm standby? And how quickly will someone notice that the main system is down?
That is what matters most. It doesn’t matter that you have a quick-acting replica if nobody knows that the primary system went offline for three hours. From there, it crunches those numbers and tells you what kind of exposure you’re actually looking at.
The first challenge when looking at this topic is to understand what RTO and RPO means. RTO is availability; how long will the lights stay out? That’s RTO. RPO is data. How far can we go back in time without causing issues? That’s RTO. All too many people mix up the terms, they assume that solving for one solves for the other, but it doesn’t.
Having continuous replication gives me a tiny RPO (very little data loss), but maybe my failover process take hours, requiring someone to make some manual DNS change, now I’ve got a massive RTO despite having a tiny RPO. Or perhaps I use active-active clustering to get an instant RTO, but the sites are synced on a delay, giving me a wider RPO. The calculator makes that clear separation so you can see where the drag is in your plan.
But the figures start to come into focus when we think about data loss exposure. An hour of data isn’t just one hour; it’s how many gigs that represents. How fast does your database grow? Ten gigabytes per hour? An unfilled RPO exposes ten gigabytes of your work. This quantity shows how hard it would of been to restore lost data. Some teams would rather stay down longer than they’d rather rebuild everything manually. Others won’t sweat it. Context trumps minutes.
That’s laid out in the reference table at the bottom of the page. Services are tiered based on how critical they is. For example, archive data can be delayed for days. Tier 0 services need an active-active architecture and a near-zero gap. This is really useful because most small business or home lab services lie somewhere in between. You don’t want to make everything Tier 0. Technically, that’s too fragile and it would be prohibitively expensive. Instead, you want to align your architecture with the cost of failure.
If a production database goes down for four hours, you lose revenue. No. Can you just watch your movies on your phone while the media server is down for four hours? Yes. The calculator will help you figure out where you are over-protecting low-value data and also where you may be dangerously exposed in high-value workflow.
So what makes a good plan? The biggest delay is usually the best place to start if you want to make improvements. For example, if your backups run hourly and take four hours due to slow network speeds, then increasing the backup frequency doesn’t help. Your RTO remains four hours. You need to address the restore path. Reducing validation steps, pre-staging images, automating DNS failover, these tend to provide more benefit than tweaking the backup schedule. The tool flags the biggest way to improve; it points to the bottleneck as opposed to the obvious but ineffective fix.
Build for the mess, not the perfection. Tech runs until it doesn’t run. Then people pick up and do what people do. It is slow. They are slow, as in they drink coffee. They are slow because they require credentials to get into systems. Slow as in they ensure the data being returned isn’t corrupt. They do this first, before they hand it off to end users. Account for that drag in your planning. The numbers will be uglier then. But when the alarm rings, you’ll have a shot at surviving with the plan. Because recovery isn’t just about data. It’s also about trust.