HomeServerBlog storage operations planner
Storage Rebuild Bandwidth Calculator
Estimate the bandwidth needed to finish a disk rebuild on time, including parity work, host workload, rebuild priority, throttling, network replication, storage media limits, and safety margin.
Rebuild bandwidth breakdown
Capacity and pressure signals
Decimal network rate for the required rebuild stream.
How much data the modeled rebuild can process per day.
Extra traffic caused by sync, replication, or backup copy activity.
Rebuild data after parity, replication, and safety margin.
| Adjusted Work | 8 Hours | 24 Hours | 72 Hours |
|---|---|---|---|
| 2 TB | 69 MB/s | 23 MB/s | 8 MB/s |
| 8 TB | 278 MB/s | 93 MB/s | 31 MB/s |
| 16 TB | 556 MB/s | 185 MB/s | 62 MB/s |
| 24 TB | 833 MB/s | 278 MB/s | 93 MB/s |
This table uses decimal TB and does not include parity, replication, or safety margin.
| Link | Practical MB/s | Best Rebuild Use | Watch Item |
|---|---|---|---|
| 1 GbE | 105 to 115 | HDD mirrors | Protocol overhead |
| 2.5 GbE | 250 to 285 | HDD parity sets | Switch buffers |
| 5 GbE | 500 to 570 | SSD NAS sync | USB adapters |
| 10 GbE | 900 to 1100 | Fast shelves | CPU and jumbo frames |
| 25 GbE | 2300 to 2800 | NVMe fabrics | PCIe lanes |
Real transfers depend on protocol, MTU, encryption, checksums, and sender or receiver CPU headroom.
| Overhead Source | Typical Add | Calculator Field | Planning Meaning |
|---|---|---|---|
| Mirror copy | 0 to 8% | Parity overhead | Mostly sequential rebuild work. |
| RAID 5 or RAIDZ1 | 10 to 25% | Parity overhead | Parity reads and metadata checks. |
| RAID 6 or RAIDZ2 | 18 to 40% | Parity overhead | More parity math and verification. |
| Snapshots or COW | 5 to 20% | Parity overhead | Metadata churn can stretch writes. |
| Remote replica | 10 to 100% | Replication | Network traffic rides with rebuild. |
Use the overhead field for rebuild work amplification, not for filesystem free-space reserve.
| Setting | Bandwidth Share | User Impact | Good Fit |
|---|---|---|---|
| Low priority | 55% | Low | Business hours |
| Balanced | 75% | Moderate | Evening rebuilds |
| High priority | 90% | Noticeable | Maintenance windows |
| Maximum | 105% | High | Emergency rebuilds |
| Heavy throttle | 50% or less | Lower | Weak disks or hot chassis |
Throttle values reduce the modeled rebuild lane after workload and storage limits are considered.
The thing is, there’s seldom anything dramatic about a drive failure. It tends to occur while you’re watching movie on a Tuesday night, you might see it as the array status goes down or recieve an email alert. But it becomes interesting when you discover that the rebuild process will take three days, or worse, maybe even five.
Most people estimate those periods roughly by raw drive speed, which isn’t a great idea. Data doesn’t travel at its raw speed; it faces traffic. In this case, planning beats out hardware spec. Think of rebuilding as balancing time against your data needs. Rebuilding a RAID5 array isn’t just copying blocks from one drive to the other; it’s reading parity, computing a new checksum and writing it back. All this happen while your backup runs in the background and your media server streams a movie.
Why Rebuilding Takes So Long
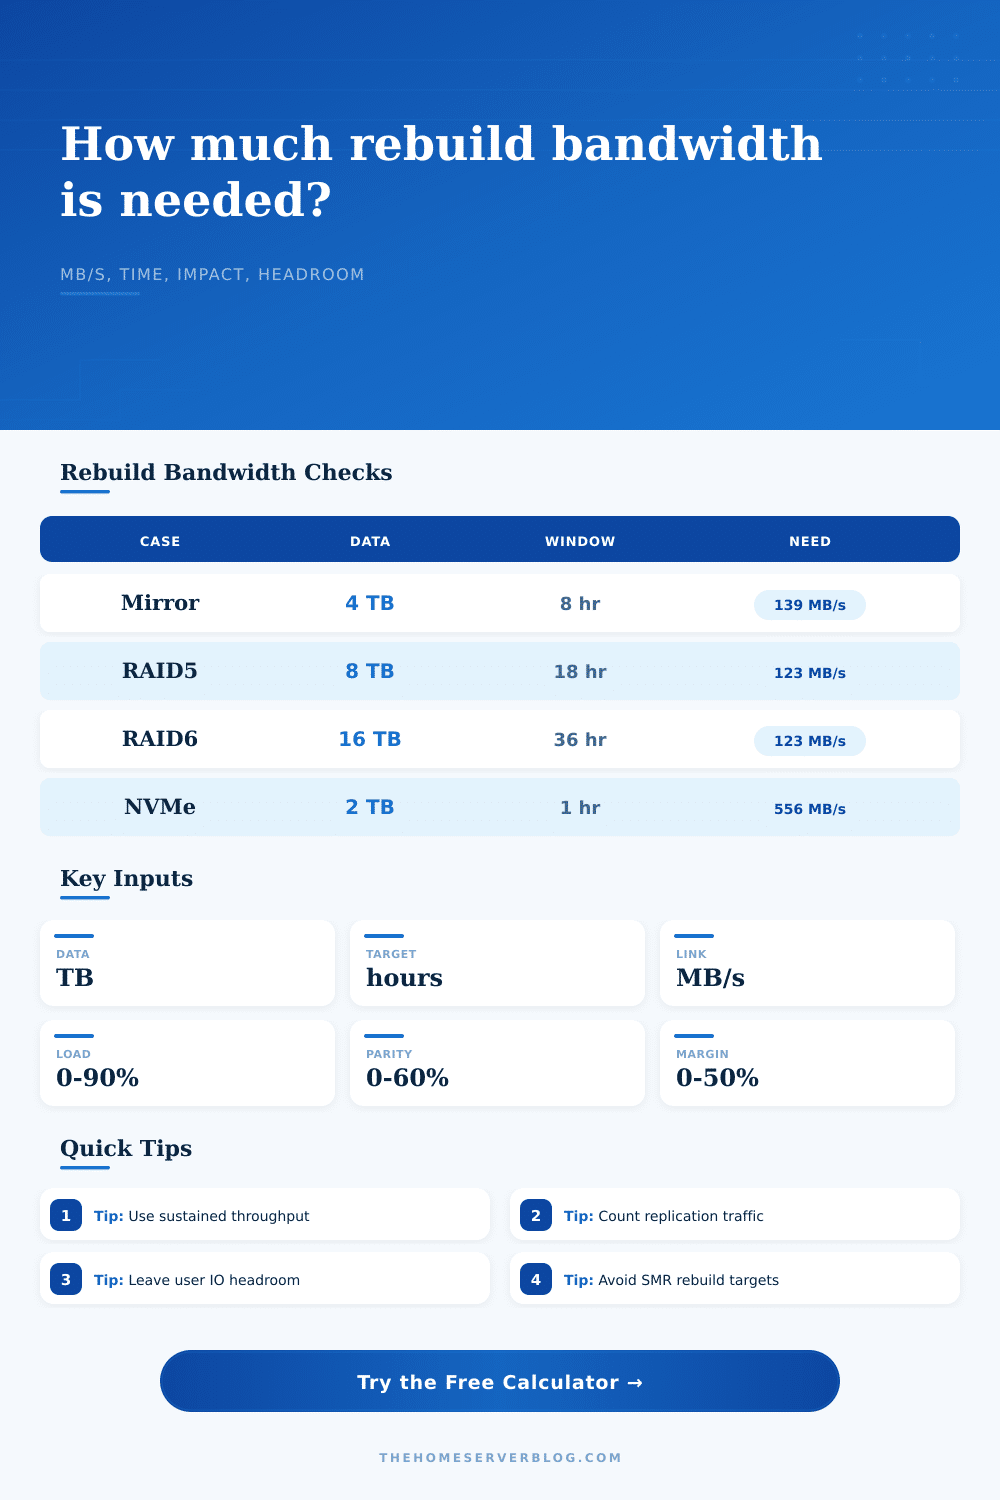
Give it your desired window and your array size, and the calculator spits out the number for you. It will save you from having to guess at conversions and coefficients, but that’s where you do the real work: knowing what those numbers represent.
But most importantly, don’t neglect the host workload. Are you running your virtual machines while rebuilding at max speed? You’ll probably run into a performance wall. You may have a high-speed rebuild “on paper” but it’s going to stall in practice when the controller gets bogged down between conflicting requests. Your active apps slows down, and the rebuild stalls in practice despite appearing fast on paper. Most people overlook this. They get excited about those empty hours of the night, and they neglect the fact that your maintenance tasks can often compete with other work such as index scans or automated backups.
How you store also matter. A CMR hard drive is going to produce a consistent rate of data, with minimal variability. An SMR drive will appear comparable on paper, but when subject to the sustained write load of a rebuild, it can throttle hard.
Solid state drives change equation entirely. Because NVMe pools are so fast, the bottleneck moves away from the disk and over to network link or even the CPU. You could have a 2000 MB/s drive, but if your network link is only 1 GbE then your effective speed tops out somewhere around 110 MB/s. This is clear in reference table on the page. It also details how much protocol overhead impacts your highest possible speeds.
Don’t neglect replication. You may want your rebuild data replicated to some other remote target as well. This extra load compounds quickly, especially if you have a safety margin built in for bad sectors or thermal throttling. That 20 percent buffer isn’t padding. It’s insurance for the moment you’ll need that drive to slow down while it’s warming up. Otherwise, the filesystem will hit a hiccup and need retrying.
You’re also not trying to get it done quickly. You’re trying to get it done in a way that doesn’t break the rest of your system. It’s much better to have a slow rebuild where your host stays responsive than a fast rebuild that makes your NAS unusable for 24 hours. You’re trading time for stability.
After crunching the numbers, consider the headroom. Running 95 percent full? You’re one little mistake away from failing. Reduce the priority. Expand the window by an hour. That’ll adjust the math while keeping your peace of mind. Storage is a patient thing. It’ll wait until you get it right.
The rebuild isn’t just data transfer; it’s a stress test of your whole stack in the end. Respect it like you would your backup strategy. Peak throughput doesn’t matter; measure sustained throughput. Don’t mess around with the host lane. And don’t forget: The best rebuild you can hope for is one on a system that survives it.