Server Rack Power Consumption Calculator
Estimate rack watts, kW, amps, BTU/hr, redundancy capacity, and PDU derating headroom for a home lab, office rack, or small server room.
📌 Rack Presets
⚙ Rack Power Inputs
Rack Power Results
Load Breakdown
🖥 Equipment Power Grid
📊 Rack Size Reference
| Rack Scenario | Typical Gear | Expected Load | Cooling Load |
|---|---|---|---|
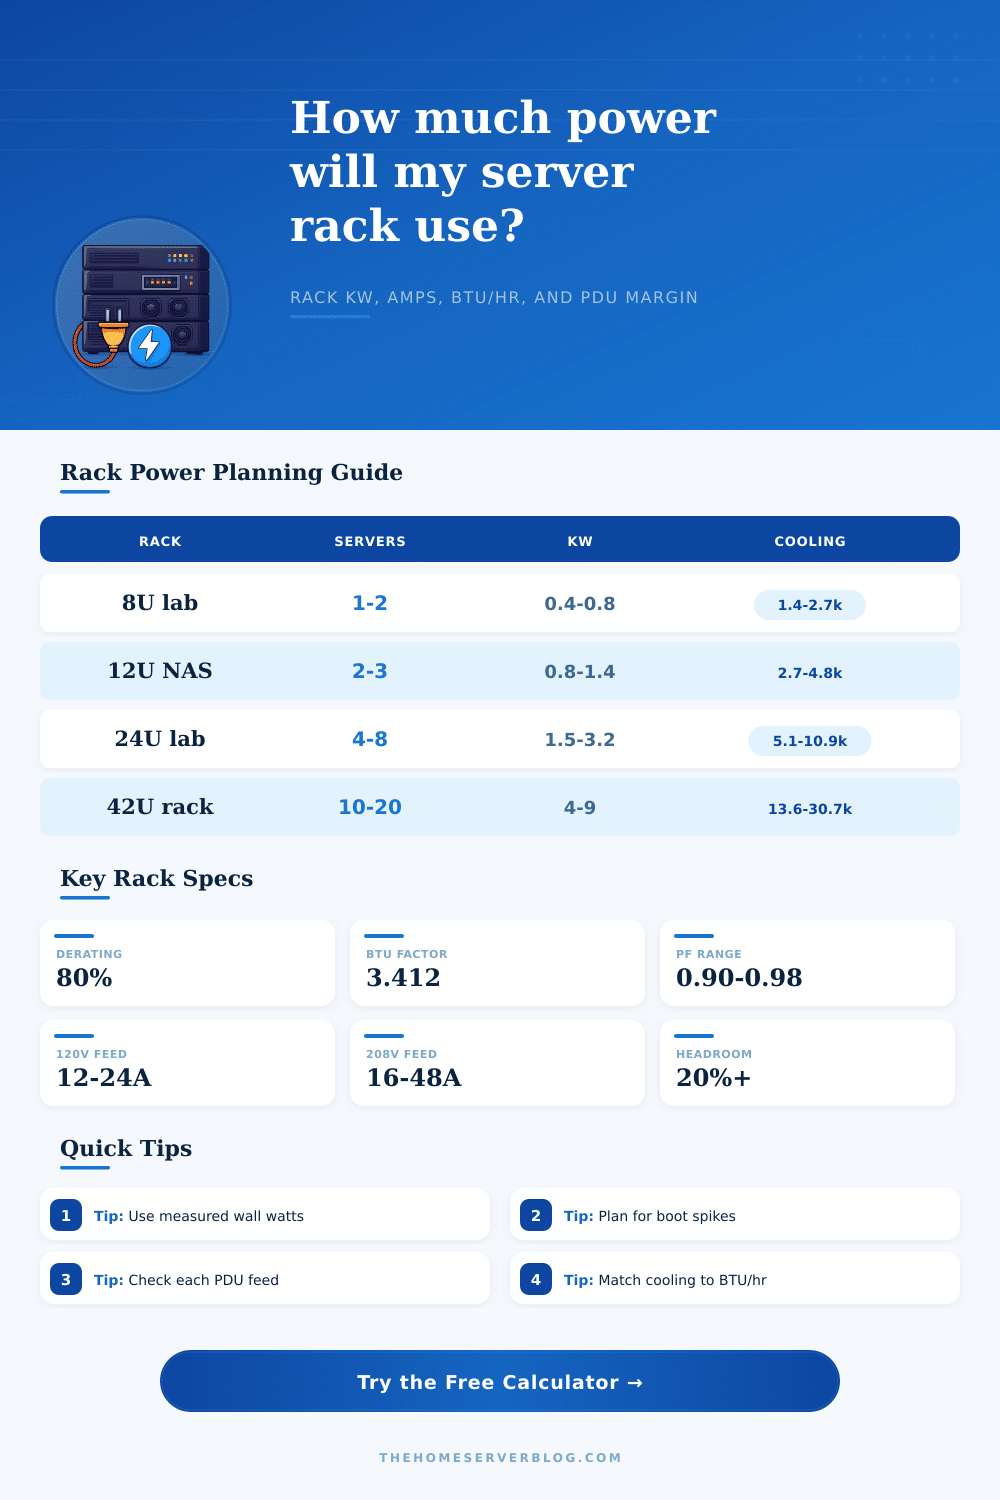
| Entry 8U home lab | 1 to 2 servers, switch, UPS | 0.4 to 0.8 kW | 1,365 to 2,730 BTU/hr |
| Quiet 12U NAS rack | NAS, mini nodes, low-noise switch | 0.8 to 1.4 kW | 2,730 to 4,777 BTU/hr |
| 24U virtualization lab | 4 to 8 hosts, storage, 10GbE | 1.5 to 3.2 kW | 5,118 to 10,918 BTU/hr |
| 42U dense lab rack | 10 to 20 servers, storage shelves | 4.0 to 9.0 kW | 13,648 to 30,708 BTU/hr |
🔌 PDU Capacity Table
| Circuit | Nameplate VA | 80% Continuous | Practical Use |
|---|---|---|---|
| 120 V / 15 A | 1,800 VA | 1,440 VA | Small network shelf |
| 120 V / 20 A | 2,400 VA | 1,920 VA | Light home lab rack |
| 208 V / 30 A | 6,240 VA | 4,992 VA | Medium server rack |
| 240 V / 50 A | 12,000 VA | 9,600 VA | Dense rack or lab row |
♻ Redundancy Planning Table
| Model | Planning Rule | PDU Check | Use Case |
|---|---|---|---|
| Single feed | Total load on one PDU | One feed must fit | Noncritical lab gear |
| A/B feeds | Each side supports failover | One feed must fit full load | Dual PSU servers |
| N+1 capacity | Add one extra capacity block | One spare margin block | Expandable rack rows |
| 2N mirrored | Duplicate full power path | Each side supports 100% | High availability rack |
🌡 Conversion and Cooling Table
| Measurement | Formula | Example | Why It Matters |
|---|---|---|---|
| Watts to kW | W / 1000 | 2400 W = 2.4 kW | Utility and rack sizing |
| Watts to amps | W / (V x PF) | 2400 W at 208 V = 12.2 A | Breaker and PDU load |
| Watts to BTU/hr | W x 3.412 | 2400 W = 8,189 BTU/hr | Cooling requirement |
| PDU derating | V x A x derate | 208 V 30 A at 80% = 4,992 VA | Continuous load safety |
💡 Rack Power Tips
The racks of servers are the determining factor in whether the laboratory remain stable or incurs excessive costs for cooling the laboratory racks each month. The power that each rack draws is made up of the power of each of the servers and devices that is contained within that rack. Furthermore, there are power spikes that occur when each of the devices within the rack are power on at the same time.
Before any devices are added to the rack, it is essential to have an understanding of the total amount of power that that rack will draw to avoid tripping circuit breaker and overheating the rack; if the person is not familiar with the power draw of the rack, it is possible that the PDUs is already operating in their limit. In determining how much power each rack will draw, many people turn to the nameplate wattage for each power supply. The nameplate wattage indicates the maximum amount of power that the power supply can handle, but does not indicate the power that the rack will draw.
How to Plan Power and Cooling for a Server Rack
The power drawn by the rack is dependent upon the work that each of the servers perform and the efficiency of the power supplies within the rack. Calculators are available to determine these computations of the power draw of the rack. After determining the base load of the rack, it is also necessary to account for overhead load.
Overheating can result from various processes and services that run in the server rack in addition to the base load of the servers. Furthermore, it is important to account for growth in the services provide by that rack. A plan that does not include growth is not a realistic one for that lab.
Furthermore, the same logic applies to implementing redundancy in the rack; each power supply in the rack may supply power to each of the servers in the rack, but in the case of failure in one of the power supplies, the other supply will have to handle the same load as well. Thus, the amount of available power on each PDU will be less than many people expect; the PDU does not have as much power available on each side as one might think when the rack is being planned. Each of the wattages of power that is provided to the rack will generate heat from each of the servers within the rack; thus, there is a direct relationship between the electrical load of the rack and the amount of heat that will be given off of the rack.
Planning for cooling in the rack is treated as a separate project from the electrical load of the rack; however, treatment of the cooling requirements of the rack as a separate project may lead to a cooling system that is unable to handle the heat output of the rack once all of the servers are added to that rack. Thus, it is important to plan for both the electrical load and cooling requirements of the rack at the same time. The limit of the electrical circuits and the PDUs within each rack have an impact upon power planning within that rack.
Circuit breakers are not meant to be in operation at their stamped amperage continuously, and there are derating rules for the circuits that account for the heat that builds up within those circuits and within the PDUs. As a result, the amount of load that can be provided to a 30 amp circuit continuously is less than that 30 amp rating; the calculations of power within the rack account for derating rules for the circuits. The voltage and power factor of the power supply also have an impact upon planning for the rack.
Higher voltages reduce the amount of current that is required to supply the same amount of power; thus, higher voltages reduce the amount of heat that build up in the power supplies. The power factor is the amount of current that is provided to the servers that performs useful work; the power factor of moddern power supplies tends to be positive, but some of the older power supplies can have a power factor that reduces the amount of current that can be supplied to the rack. Reference tables are also provided that allow for an understanding of how the power requirements of a small laboratory rack may compare to a 42U cabinet of rack servers, and the amount of power that can be supplied to a circuit after derating is applied to the circuit.
Finally, it is also important to determine if there is enough margin within the rack relative to the power that is being supplied. A rack that is operating at 95% of its available power has no margin for adding new servers or new storage to that rack; it also does not have the power to handle the power surges that can occur when the UPS for the rack is switched from one power supply to the other. Thus, providing margin for the rack is a good practice; it is the difference between having a reliable rack and having a rack that requires constant monitoring.
Using the calculations provided by the calculator, it is possible to determine if there is an adequate margin within the rack for the servers that are deployed. Furthermore, in addition to determining the adequacy of the power supply for the servers that are present within the rack, it is also important to determine if the power supply for the rack will allow for additional projects within the future. Providing margin within the power supply for the rack is what ensure that the rack will remain workable in the future for the laboratory.