SLA Uptime Calculator
Convert an uptime target into an error budget, compare real outage minutes, and see whether your home server or lab service is inside its SLA window.
SLA uptime result
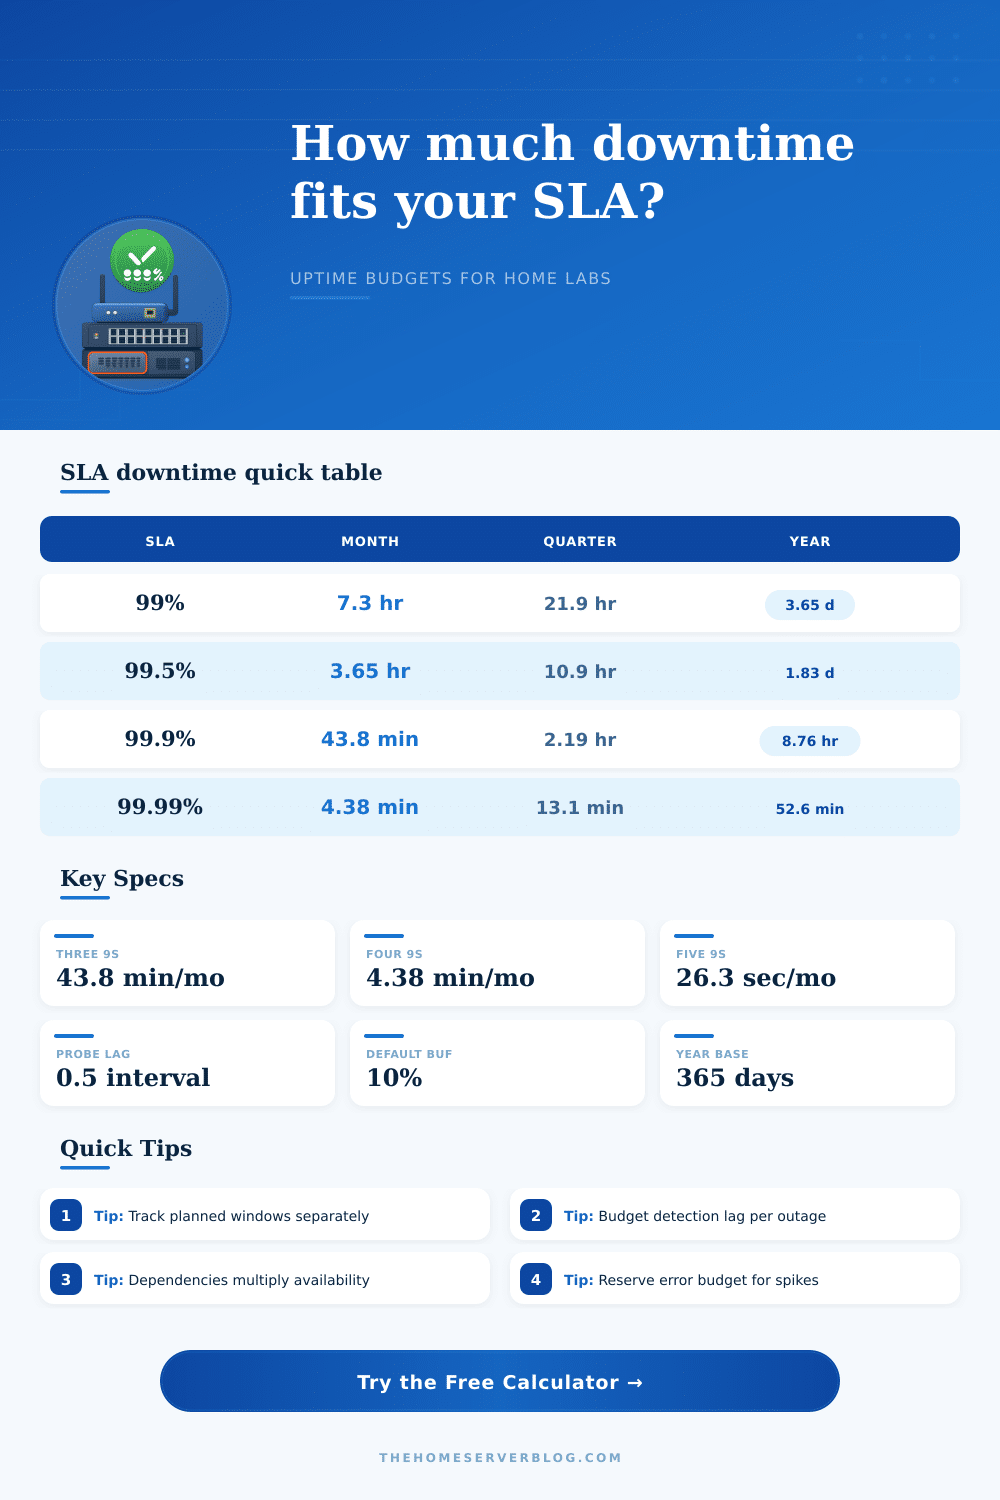
| Availability target | Allowed per average month | Allowed per quarter | Allowed per year |
|---|---|---|---|
| 98% | 14 hr 37 min | 1 day 19 hr | 7 days 7 hr |
| 99% | 7 hr 18 min | 21 hr 55 min | 3 days 15 hr |
| 99.5% | 3 hr 39 min | 10 hr 57 min | 1 day 19 hr |
| 99.9% | 43 min 50 sec | 2 hr 11 min | 8 hr 46 min |
| 99.95% | 21 min 55 sec | 65 min 45 sec | 4 hr 23 min |
| 99.99% | 4 min 23 sec | 13 min 9 sec | 52 min 34 sec |
| 99.999% | 26 sec | 79 sec | 5 min 15 sec |
| Downtime category | Usually counted? | Calculator handling | Home lab note |
|---|---|---|---|
| Unplanned outage | Yes | Incident count multiplied by average duration | Use alert timeline, not memory |
| Monitoring lag | Often yes | Adds one half probe interval per incident | Short probes reduce blind spots |
| Planned maintenance | Depends | Can be excluded from denominator or counted | Document the window before work starts |
| Degraded service | Depends | Represent with shorter incident minutes | Count only user-visible impact |
| Single user issue | Usually no | Leave out unless service-wide | Separate client WiFi from service SLA |
| Service path | Simple formula | Example result | Planning meaning |
|---|---|---|---|
| One dependency at 99.9% | 0.999 | 99.9% | The dependency can meet a 99.9% service only if everything else is near perfect |
| Three serial dependencies at 99.9% | 0.999 to the third | 99.700% | WAN plus switch plus host can miss a three nines target |
| Five serial dependencies at 99.95% | 0.9995 to the fifth | 99.750% | More critical links require better parts or redundancy |
| Two active service paths at 99.5% | 1 - failure squared | 99.9975% | Redundant service paths help when failures are independent |
| Shared power or shared ISP | Common mode | No multiplier | Do not count redundancy when both paths fail together |
| Project | Typical target | Primary budget | Operational focus |
|---|---|---|---|
| Family NAS access | 99% | 7.3 hours per month | Backups, UPS runtime, clean shutdowns |
| Remote media streaming | 99.5% | 3.65 hours per month | Router stability and WAN failover |
| Home VPN or password vault | 99.9% | 43.8 minutes per month | Automated restart, DNS health, alerting |
| Public reverse proxy | 99.99% | 4.4 minutes per month | Redundant hosts and external monitoring |
| Scheduled offsite backups | 98% | 14.6 hours per month | Recovery point objective beats raw uptime |
SLA uptime targets describes the amount of downtime that a companys services can have. SLA uptime targets can be difficult to manage in a home environment. An SLA uptime target is a measurement of the amount of time that the services remains operational.
However, it is also a measurement of the amount of time that a person have to spend fixing the service should it fail. Many people select an SLA uptime target without having a good understanding of the degree of maintenance that will be required to maintain that uptime target. Consequently, people often discover that maintaining the uptime target require more monitoring and maintenance than they have initialy anticipated.
How SLA Uptime Targets Work
The calculator included on this page can assist with the mathematical conversions from the percentage values of an SLA uptime target to the number of minute of downtime that a service can have. This calculation utilizes the service profile information, incident information, and the measurement window to provide an accurate value of the allowed downtime. Each of the inputs to the uptime target calculator can have an impact upon the meaning of the resulting error budget.
The service profile information for a system can help to explain how the system is configured to function within the home. For instance, the service profile information may describe the number of critical link in the system, as well as the speed at which the system can traverse each link. The measurement window during which the uptime target will be evaluated can also have an impact upon the error budget.
For instance, if an individual change the length of the measurement window, the same uptime target will have a different meaning within that new period of time. The number of outages within the system and the length of time of each of those outages will have an impact upon the error budget. The longer that it takes to detect an outage, the less error budget are available to the individual.
Factors such as the probe interval that is used within the system to detect system outages will impact the amount of error budget that is available. Should the system use short probe intervals, there is less time for the system to go without detection. However, there is more noise in the monitoring system if there are short probe intervals.
If the probe intervals are long, there is less noise in the monitoring system. However, there is a greater chance that system outages will go unnoticed if the intervals between probes into the system are long. Half of the probe interval is added to each incident in the system because the uptime target calculator must account for the length of time that outages goes unnoticed by the monitoring system.
The way in which maintenance is treated within the system can also have an impact upon the error budget. For instance, some individuals may consider maintenance to be outside of the error budget. Other individuals may consider any period of time without the ability to provide the service to its users to be within the error budget.
The longest outage that occurs within the system can be entered into the uptime target calculator. This field permits the individual to evaluate whether the current outages of the system is already outside of the SLA uptime target. Should the length of time that it took for the system to correct the outage be outside of the SLA uptime target, then the SLA is broken for that individual, regardless of the uptime during the remainder of the measurement window.
Dependencies upon other system components will impact the uptime of a service. For instance, if the system fails a switch, a DNS resolver, or a WAN link, the system will fail. Additionally, if there are serial dependencies upon other links, the failures of those links will have an impact upon the uptime of the system.
For instance, the availability of a system with three serial links may be less than 99.9 percent, despite each link having a 99.9 percent uptime. The system can also have dependencies upon links in parallel with the system itself. For instance, if the system has redundant servers that share power and an ISP, there is the potential for a failure of those components to prevent the system from providing its service.
These dependencies can each be entered into the uptime target calculator to determine whether the components of the system will meet the uptime target that is establish for the system. The uptime that is measured for a system is calculated by taking the length of the measurement window and subtracting the length of the downtime that is counted within the system during that period. The result of this calculation is the amount of time that the system was operational during the measurement period.
This time value can also be used to determine if the system remained within its SLA uptime target or if it used up its error budget for the period. The error budget for a system is the buffer for the inaccuracies in the systems monitoring processes; without the error budget, the system may be reported to have failed its SLA if it experienced an outage that is not account for by the monitoring software. The reference tables provide an understanding of how many minutes of downtime are allowed for SLA uptime targets with different numbers of nines in their uptime target.
For instance, the reference tables show that most home network have a service uptime that is between two and three nines of availability but do not reach four or five nines of availability. Four nines of availability allow only single-digit minutes of downtime per month. To achieve four nines of availability, the individual must establish redundant hardware for the system and the individual must pay constant attention to the system.
The reference tables make visible to the individual the tradeoffs between uptime targets and the effort required to provide those uptime targets. Some of the common mistakes that individuals make when establishing an uptime target include treating maintenance of a system as if it doesnt count against the error budget. Other mistakes include ignoring the time lag in detecting system outages, and ignoring the impact that the systems dependencies upon other system components have upon its uptime.
Another common mistake in establishing an uptime target is to establish an ambitious target without first determining the length of time that system outages take to resolve. The uptime target calculator can help individuals to see the gap between an ambitious target and the actual performance of the system. By utilizing the uptime target calculator to establish various scenario for a system, individuals can identify that systems that can better endure outages can utilize a 99 percent uptime target.
However, systems whose failures would have a significant impact upon the users of those systems have a need for a higher degree of uptime; these systems will have a tighter uptime target. The goal in establishing an SLA uptime target is not to achieve the best possible uptime target, but rather to recognize how much downtime an individual is willing to accept.