HomeServerBlog reliability inventory planner
Spare Parts Stocking Calculator
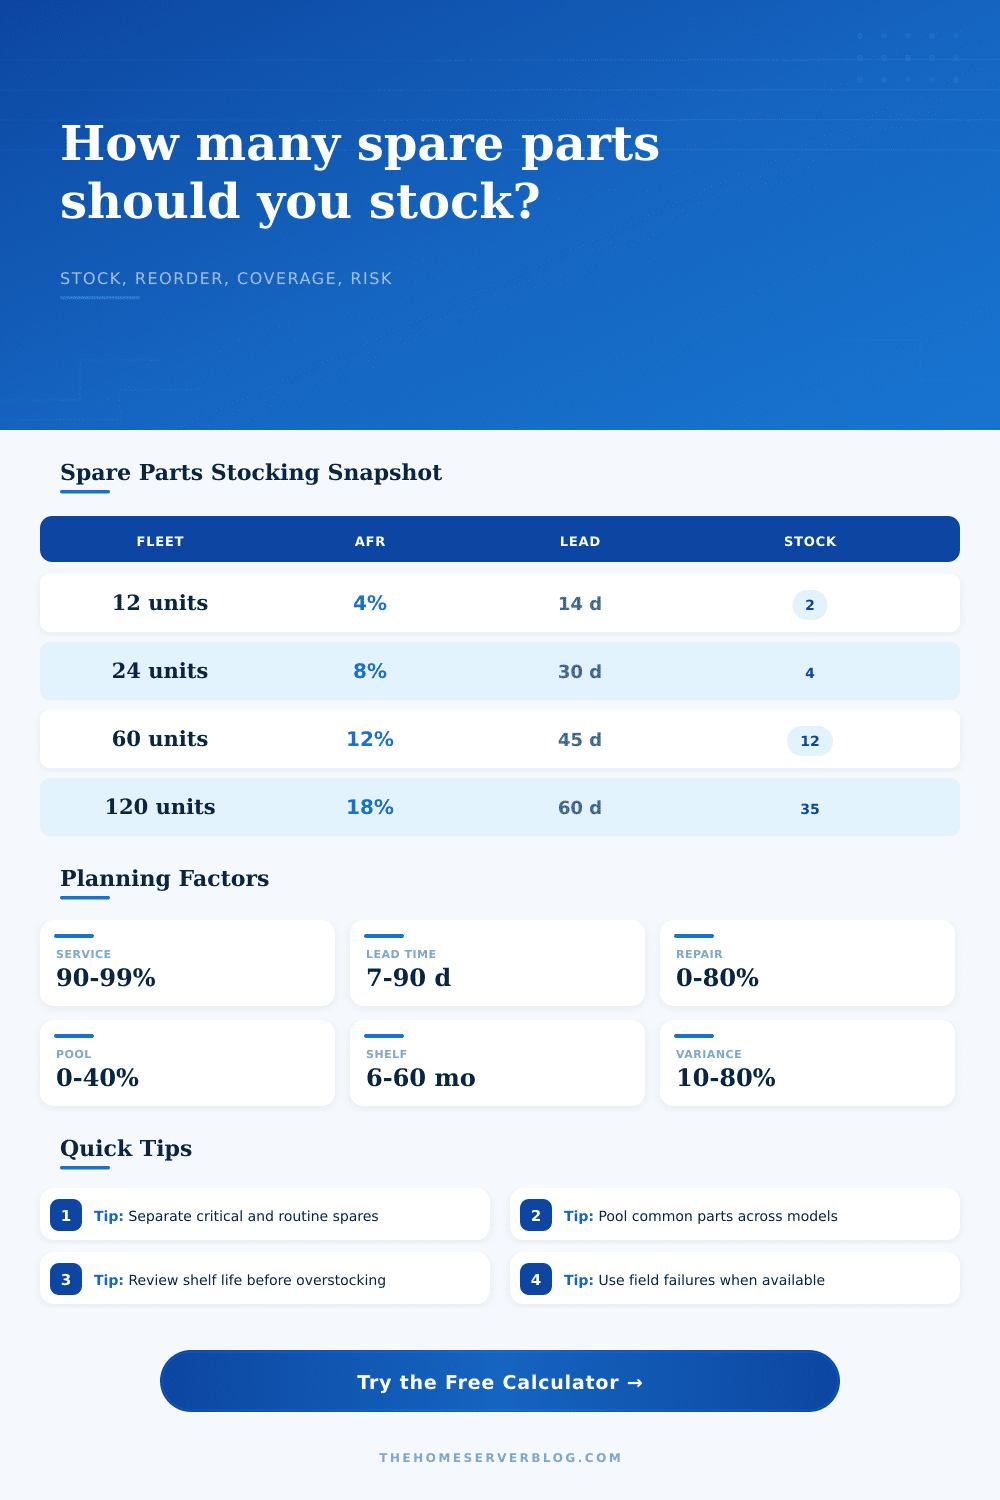
Estimate recommended spare stock, reorder point, coverage days, shortage risk, repairable return credit, common-parts pooling, shelf-life pressure, and variance buffer for home lab and small infrastructure fleets.
1Spares presets
2Installed base, lead time, and policy inputs
Stocking breakdown
Policy checks
3Live planning indicators
Adjusted expected part replacements per year after pooling and repair credit.
Extra units driven by service level, variance, and protection time.
Suggested upper bound before parts may age faster than they are used.
Difference between current stock and the recommended shelf quantity.
4Part criticality grid
Routine
Low downtime effect, easy sourcing, and workable substitutes. Keep enough for planned swaps and common mistakes.
-Operational
Failure causes degraded service or inconvenient maintenance, but workarounds are available.
-Critical
Failure stops a service, affects remote access, or blocks recovery during the reorder window.
-Strategic
Long lead time, model lock-in, batch risk, or end-of-life exposure makes the part hard to replace quickly.
-5Spares planning tables
Coverage by stock level
| Stock level | Coverage days | Lead-time risk | Planning read |
|---|
Lead time sensitivity
| Lead time | Expected demand | Safety stock | Reorder point |
|---|
Service level guide
| Service target | Z factor | Typical use | Inventory effect |
|---|---|---|---|
| 85% | 1.04 | Routine local spares | Lean |
| 90% | 1.28 | Home lab working stock | Moderate safety stock. |
| 95% | 1.65 | Important services | Strong default for outages. |
| 98% | 2.05 | Remote or hard-to-reach gear | More shelf pressure. |
| 99% | 2.33 | Critical path parts | High buffer requirement. |
Part family behavior
| Part family | Failure shape | Shelf concern | Stocking note |
|---|---|---|---|
| Storage drives | Batch and workload | Warranty and age | Pool by capacity, firmware, and sled. |
| Fans | Wear and dust | Bearing age | Keep model-specific trays labeled. |
| Power supplies | Heat and load | Connector fit | Verify wattage, latch, and airflow side. |
| Optics and DACs | Low but spiky | Compatibility | Separate known-good transceivers by speed. |
| UPS batteries | Calendar age | High | Shelf life often caps stock before demand. |
6Two spares planning tips
When equipment break down, you should of have spares in stock to give yourself some breathing room. Infrastructure feels brittle when it take a long time to get a replacement part, just like a server that shuts down because of a failed power supply.
Probability math takes into account your expectation of failures and fleet size; it’s easier than trying to guess how many fan or drives to have around. First, establish your annual failure rate. People tend to make a best guess based off the spec sheet from manufacturer. This is a bad idea: field data paints a different picture. Vibration, dust, heat; these aren’t accounted for by factory testing. If your equipment operates 24/7 or resides in an unconditioned garage, bump up your failure rate accordingly. The higher your failure rate, the greater your expected demand, so more inventory will be needed to feel confident.
How to Keep the Right Amount of Spare Parts
The other side of lead time: It’s not shipping time. That includes administrative lag: noticing a failure, approving a purchase, and waiting for the order. A ten day from-detection-to-installation lead time isn’t just 3+7, but rather 10. Your safety stock has to span all of that, as longer replenishment windows pushes safety stock upward. See the table of references below; notice how higher refill times shift safety stock and cycle stock up.
Finally, inventory can be reduced through pooling. If you have lots of the same thing; like if you operate a fleet of identical switches, then you don’t need a spare on every single device since failures are random events that don’t occur in lock-step with one another. By using a common pool of spares among several devices, you even out numbers and average out the randomness. This keeps service levels high while lowering overall inventory.
Repairability lowers actual consumption. If a failed hard drive can be wiped and returned to service, your effective consumption rate drop. You don’t consume a fan tray until you rebuild it when one fails. When the calculator estimates how much you need to hold, it assumes that some percentage of failed parts goes back into usable stock. This decreases your holding costs actualy.
But you still need to consider shelf life versus demand. Batteries get old sitting around; batteries lose capacity while being unused, seals dry up, plastics grow brittle, etc. If suggested stock says hold 20 of a part that has a 2 year shelf life, you’ve got trouble since at any given time half of what you’re holding is going to waste. That’s a case where lowering target stock and relying on quicker reorder triggers to extend shelf life would be appropriate.
How risky do you want to be? That’s determined by how important a component is, i.e., would it be an issue if a part failed, or does it shut down the whole system? For instance, replacing a non-critical cable doesn’t matter if you have spares on hand, yet a critical controller board shutting down your production database could kill company. To account for this, the calculator allows you to add a criticality factor that will increase safety buffer of important components.
There is variance. Some parts follow a consistent failure pattern, whereas other batches can go haywire and fail chaotically based off environmental shocks or defects. Telling the system that supply is spiky increases variance, which require more buffer to prevent running dry when there’s a spike.
Predicting the future isn’t part of stocking spares. Stocking spares is all about having enough hardware on hand to swap-in right away, but not so many parts that they go bad sitting on the shelf. It’s about resilience (not excess). You don’t want your next component failure to become a financial one; you want to reach for a spare, not a credit card.
The key: plan properly, and what could of been a disaster becomes nothing more than a minor inconvenience. And inventory just sits there quietly waiting, while you continue your daily operations.