HomeServerBlog storage performance tool
Storage Latency Percentile Calculator
Estimate average, p95, p99, tail spread, queue pressure, cache behavior, and SLA fit for NAS shares, VM datastores, databases, backup targets, and mixed home lab storage pools.
Latency Breakdown
Tail And Queue Signals
Average after cache, write mix, and queue effects.
Selected percentile minus the target latency.
Requests still hitting the underlying storage path.
Media capacity after headroom reserve.
| Metric | What It Means | Home Lab Use | Watch Point |
|---|---|---|---|
| Average | Mean latency across all IOs. | Good for long-term trend baselines. | Can hide short stalls. |
| p95 | 95 percent of IOs finish at or below this value. | Useful for general app responsiveness. | May miss rare VM pauses. |
| p99 | Only 1 percent of IOs are slower. | Best quick signal for tail pain. | Needs enough samples. |
| p99.9 | Extreme outlier region. | Useful for databases and sync writes. | Very sensitive to bursts. |
| Media | Typical Service | Queue Behavior | Practical Fit |
|---|---|---|---|
| NVMe SSD | 0.03 to 0.20 ms | High parallelism. | VM, database, metadata. |
| SATA SSD | 0.08 to 0.60 ms | Moderate parallelism. | General NAS apps. |
| SAS SSD | 0.10 to 0.80 ms | Stable under queue. | Enterprise lab shelves. |
| 7200 RPM HDD | 8 to 18 ms | Queue grows quickly. | Media and backup. |
| USB HDD | 12 to 30 ms | Bridge adds jitter. | Offline copies. |
| Queue Signal | Utilization | Latency Effect | Common Cause |
|---|---|---|---|
| Quiet | Under 45% | Percentiles stay close. | Spare media capacity. |
| Busy | 45 to 65% | p95 begins to widen. | Normal active users. |
| Contended | 65 to 80% | p99 climbs quickly. | Scrubs, imports, VMs. |
| Saturated | Over 80% | Tail becomes unstable. | IOPS above capacity. |
| Workload | Tail Driver | Cache Helps | SLA Cue |
|---|---|---|---|
| VM datastore | mixed random IO | Sometimes | Track p99. |
| Database lab | sync writes | Reads mostly | Track p99. |
| Media share | metadata misses | Often | Track p95. |
| Backup target | burst flushes | Limited | Track p95. |
| NVR archive | steady writes | Low | Track average. |
When you boot a virtual machine or load up a file, you sit there at your computer waiting for it to happen. The progress bar pauses for a second or two and then everything pops in all at once. That’s because what you’re seeing isn’t average latency but rather the fact that you noticed the stall.
The problem with using mean as a way to look at storage performance numbers is that it smooth over the actual peaks and troughs of what a hard drive do. The average makes the slowdown invisible To save you from having to guess queueing theory and coefficients, we handle all the math with the calculator above.
Why Storage Speed Is About Stability, Not Just Average
To use it well, however, you should understand what’s happening under the hood. Latency isn’t a single number. Latency is a distribution. An average latency of four milliseconds means that typical request takes four milliseconds. Entering a p99 latency of thirty-five milliseconds means that one percent of your requests take up to thirty-five milliseconds. The worst case.
In a system serving hundreds of request per second, that one percent occurs dozens of times every minute. This is where people commonly get it wrong. They optimize for the average, yet wonder why their system feel sluggish during peak hours.
Inputs: They tell a story. What kind of workload do you have? Is it sequential reading or random writing? Because the cache works wonders on sequential reads. Most of your workload is probably sequential when you’re running Plex as a media server. However, if you have a Proxmox VM pool or database, that’s random work. That creates jitter, as disk head has to seek around (on a spinning drive), or random IO forces an SSD controller to manage garbage collection.
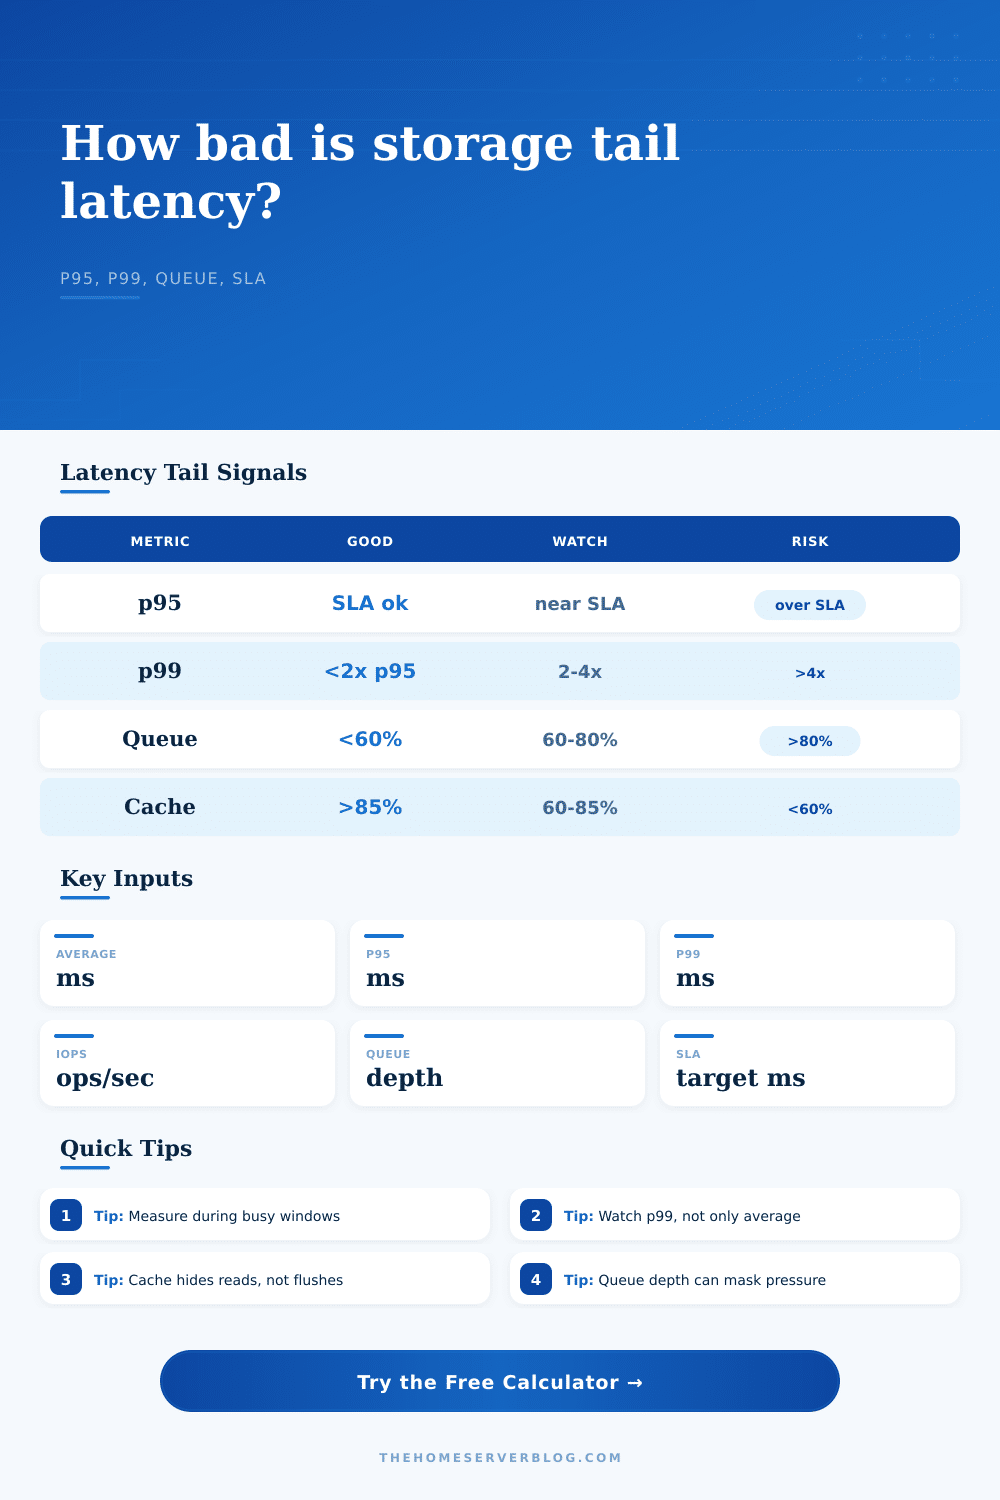
The Queue Depth Input is critical here. It’s the number of outstanding requests waiting for service. Basically, if the queue depth is low, then the disk is sitting there idling, waiting for its next job. High queue depth mean jobs are piling up. Latency doesn’t rise linearly when the queue gets deep. Instead, it spikes. The calculator models this non-linear behavior to show how a small increase in load causes such a huge jump in p99 latency.
Another critical factor is the cache hit rate. If your cache rate is high, that means your system are able to serve you data out of RAM, which is almost instantaneously. It hides the slow disk underneath. That’s great when you’re reading the same file over and over again. It falls flat on its face when you write new stuff. Often writes won’t go through the read cache at all; they go right to the disk, which is slower. So even with an awesome high cache hit rate, you might still have horrible write latency. Your system will feel super-fast, until you need to save something. Then it’ll grind to a halt. The tool splits those apart so you can tell whether your cache is helping as a hero or hiding problems.
What about the media? While an NVMe drive has latency down at the microsecond level, that doesn’t mean it won’t stutter under load. A mechanical hard drive is limited by its mechanics. Random IO is too much for them to move quickly. Nothing you do to tune queues will help; you’re using a hard drive as a database and you’re screwed. The physics will get you every time. The calculator uses realistic service times for all of these types of media, basing your expectations on the realities of what the hardware provide. No more expecting enterprise SSD performance out of your USB thumb drive.
The problem isn’t tail; it’s tail risk. It is the distinction between a system that works and one that works reliably. A p99 latency that is four times your average is a flag. That means you have no headroom in your system. Anything, even a minor burst such as a firmware update or backup job, will shove that tail right into timeout land. Users complain. Applications time out. Your system appears broken.
You know if you’re OK by comparing your p99 to your Service Level Agreement target. Close? You’d better either up your capacity or move to a faster tier. In short, “it’s all about predictability in storage.” At 2 PM, you’d like the disk to do what it did at 2 AM. And the calculator lets you see that. It visualizes the raw data from whatever monitoring tools you’re using; then it gives you a picture of the risk profile. No more guessing “why did the system slow down?”. You can now see where the pressure builds up. Turn abstract numbers into steps you can take.
So next time you’re on a slow system don’t only glance at the mean, check out the tail. Is the cache trying to lie to you? How’s the queue doing? How do you know it won’t crash your workflow? These measurements will help identify the bottleneck so you can have stable systems that aren’t just fast. Speed isn’t everything. Stability is. That’s what you’re making.