STP Path Cost Calculator
Compare STP, RSTP, and MSTP root path totals for real Ethernet uplinks, port channels, and backup paths.
| Link type | Bandwidth | Long path cost | Where it appears |
|---|---|---|---|
| 10 Mb Ethernet | 10 Mbps | 2000000 | Very old hubs, media converters, or lab recovery links. |
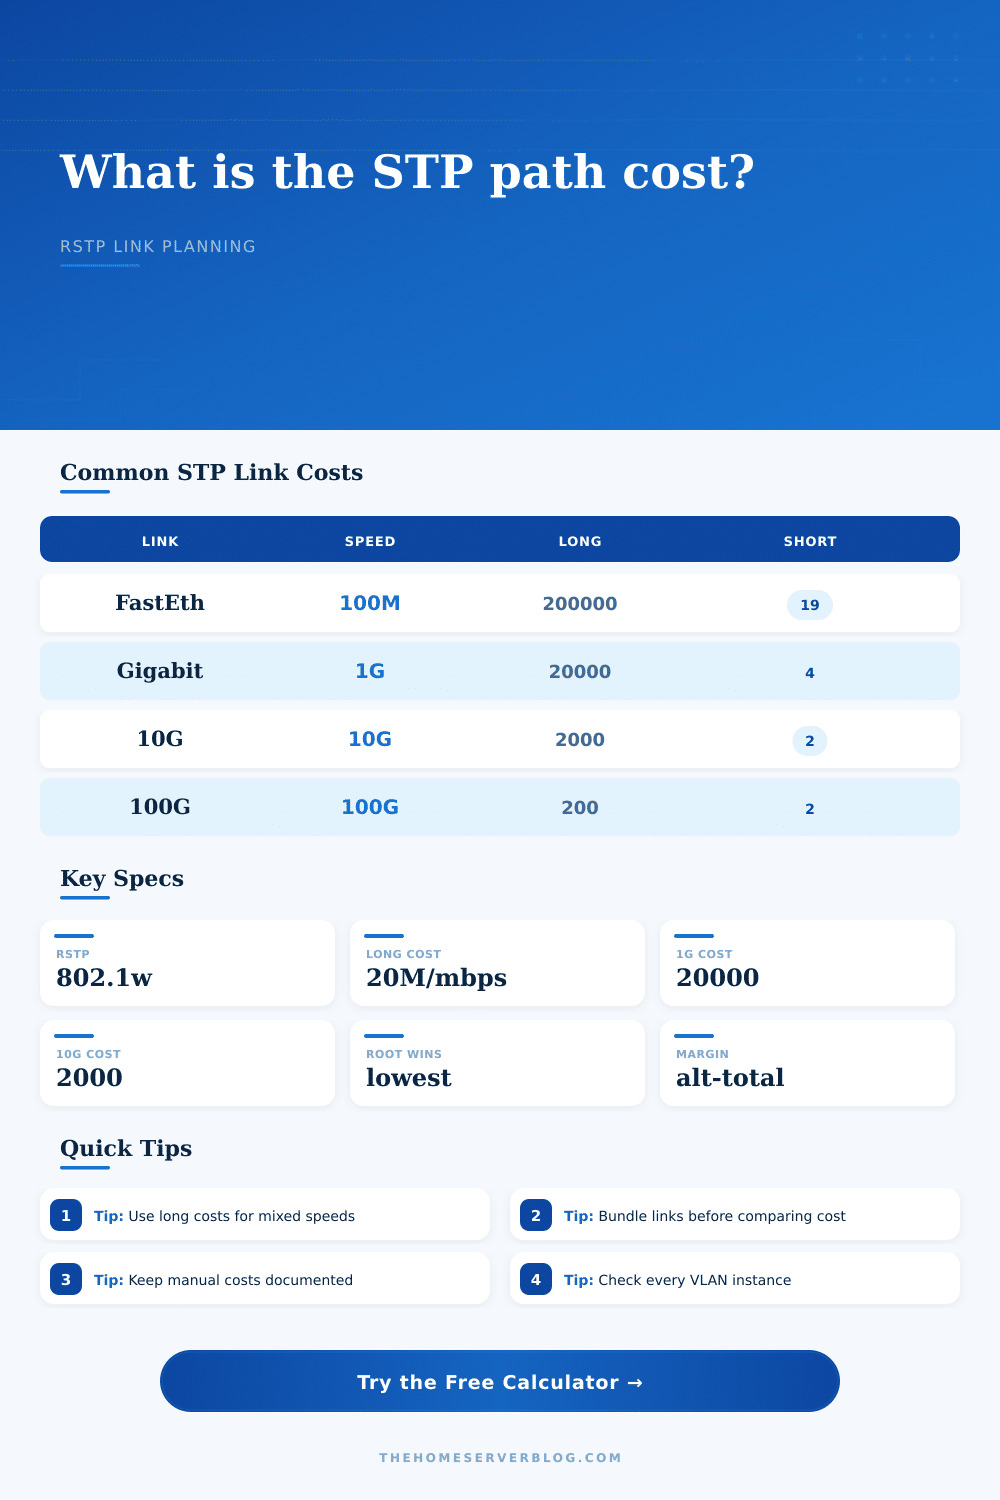
| Fast Ethernet | 100 Mbps | 200000 | Older smart switches, IP cameras, printer segments, fallback links. |
| Gigabit Ethernet | 1 Gbps | 20000 | Common access uplinks, AP trunks, NAS fallback, firewall LAN ports. |
| 2.5G Ethernet | 2.5 Gbps | 8000 | Wi-Fi 6 AP uplinks, compact home lab switches, desktop NICs. |
| 5G Ethernet | 5 Gbps | 4000 | Multi-gig access switches and short copper uplinks. |
| 10G Ethernet | 10 Gbps | 2000 | SFP+ switch uplinks, server NICs, core distribution links. |
| 25G Ethernet | 25 Gbps | 800 | Storage nodes, hypervisor clusters, newer lab switches. |
| 40G Ethernet | 40 Gbps | 500 | QSFP aggregation and high-throughput home lab cores. |
| 100G Ethernet | 100 Gbps | 200 | Advanced lab spine links and reused datacenter switching. |
| IEEE short value | Link speed | Practical limit | Planning note |
|---|---|---|---|
| 100 | 10 Mbps | Can rank old Ethernet cleanly. | Use only when every bridge uses compatible short values. |
| 19 | 100 Mbps | Distinct from 10 Mbps and 1 Gbps. | Still common on older switches that expose only short mode. |
| 4 | 1 Gbps | Coarse for modern mixed-speed designs. | Cannot show much separation between 10G and faster links. |
| 2 | 10 Gbps and faster | Many fast links collapse to the same value. | Prefer long method when 10G, 25G, 40G, or 100G coexist. |
| Design | Local link | Root path example | Expected STP behavior |
|---|---|---|---|
| Access switch to core | 1G copper | 0 + 20000 = 20000 | Likely root port when the alternate path is slower or farther away. |
| AP trunk through PoE switch | 1G copper trunk | 20000 + 20000 = 40000 | Forwarding if the direct uplink has the lowest advertised total. |
| Storage switch to core | 2x10G port-channel | 0 + 1000 = 1000 | Very likely preferred when treated as one logical bundle. |
| Backup garage switch | 100M copper | 20000 + 200000 = 220000 | Usually alternate or blocking behind a 1G primary path. |
| Ring between lab racks | 10G SFP+ | 2000 + 2000 = 4000 | One side forwards and the higher-cost loop segment blocks. |
| Spine to leaf pair | 40G QSFP | 0 + 500 = 500 | Preferred over 10G unless bridge priority or manual cost changes it. |
| Decision signal | Lower or higher wins | Used when | Design check |
|---|---|---|---|
| Root bridge ID | Lower wins | Electing the root bridge for the VLAN or instance. | Set core bridge priority intentionally, not by accident. |
| Root path cost | Lower wins | Choosing a root port on each non-root switch. | Compare the calculator total against every alternate path. |
| Sender bridge ID | Lower wins | Breaking ties after equal root path costs. | Use deterministic bridge IDs for paired distribution switches. |
| Sender port ID | Lower wins | Final tie-breaker between equal links from the same bridge. | Label patch panels and ports so failover behavior is traceable. |
At some point you will hit a network that simply doesn’t seem to work for no apparent reason. Everything seemed fine until suddenly your laptop can’t connect to anything and yet your printer on the other side of room connects just fine via its wire connection. Rebooting the router and checking the cable don’t does anything. What’s really happening isn’t that the hardware failed. It’s that the loop protection logic decide something was wrong and blocked along the wrong path.
Spanning Tree Protocol protects against broadcast storms, establishing a single active path between any two points. And it do so using a simple metric to decide what to choose. That metric is called path cost. Path cost isn’t a measure of packet loss, or jitter, or even latency. Path cost is an abstract number that gets applied to the speed of a link; the result makes higher-speed links appear less expensive to the protocol.
How to Fix Network Path Costs
In previous standards (like 802.1D), path cost was based off a very small table in which a 1 Gbps link was 4 points and a 100 Mbps link was 19 points. This made sense back when everyone was running Gigabit Ethernet. However, when you start adding 25 Gigabit or 10 Gigabit links into your network, this doesn’t work. At those speeds, the old math falls apart. You could have a 100 Gbps link and a 10 Gbps link that will both end up costing the same thing. The protocol has no idea and treats them equally. That is why moddern networks use the 802.1t long cost method because it allows for much finer granularity.
So, enter in your neighbor’s costs and your link speeds, and the calculator does the math for you. You won’t have to fumble through IEEE tables trying to cross-reference things yourself.
One thing to be aware of is how it deals with bundled links. Two 1 Gbps ports bonded together using link aggregation will appear as a single 2 Gbps logical interface to STP. That is what your cost will be calculated against (the bundle’s aggregate bandwidth). Leave them separate (i.e., as physical interfaces) and the protocol will select one and block the other completely; you lose half your available bandwidth and lose redundancy without gaining throughput. Bundling makes a big difference.
Imagine you have a home lab set up and you connect your storage node to your core switch over 25 Gigabit Ethernet. The long cost for that link is 800. Then you connect your storage node to another machine via an older access switch running 100 Mbps Fast Ethernet as your backup path. Guess how much it’s going to cost for that old legacy link: 200,000. Yeah, so the protocol won’t pick that backup path ever, right? Except when the primary link goes down totally. And generally speaking, you don’t want the primary path to go down. Everything is fine so far.
Then one day, you accidently downgrade the primary link to 1 Gigabit. Cost of that is now 20,000. It is still significantly less than the backup, but not by as much. And then if your upstream switches adds their own path costs to the mix, those numbers accumulate quickly.
Make sure all of your switches use the same calculation method. In this case, if you have a mix between the long cost and the short cost methods (a single switch is set for the short method and its adjacent switch is set for the long method), then they’re speaking different languages because they use different math. A 10 Gbps link may be calculated at 2,000 points by one switch and only 2 points by another. The mismatch will lead to erratic blocking behaviors. Underestimating the cost of a link could cause traffic to route down a slow link. Ensure that your whole network forces the same mode.
Most modern managed switches come out of the box with long method enabled. However, some vendors or older gear can throw a wrench into things. If you run Multiple Spanning Tree, check each VLAN instance. Each VLAN may have its own root bridge and its own path costs. For example, your voice VLAN might have an optimal link while your guest Wi-Fi has a suboptimal link.
Before you make any changes to your configuration, the calculator visualizes all of this for you. It also shows you the failover margin. That’s the number that tells you how far away from failing over you realy are. If you’ve got a lot of margin, then it means you’re pretty stable. If you have low margin, it means you’re getting close to a flapping state.
In short, it’s all about control with STP. And it brings order to the spaghetti of potential loops. You don’t want the protocol making guesses and you want it to do what you told it to do. Path cost is the lever that you pull to guide traffic whether it’s for a complex spine-leaf fabric or just a simple four-switch ring.
The network will behave if you get the numbers right; you will spend hours chasing log file errors if you get it wrong. It’s a small thing but it makes a difference. Make sure the network knows where to send traffic. Prevent loops and preserve the path. Let the protocol do what it was designed to do. Keep the path costs down on your best paths and keep the backup costs high.