Three Phase PDU Load Calculator
Estimate PDU kW, kVA, per-phase current, breaker margin, failover headroom, receptacle density, and phase imbalance from real rack load inputs.
Load breakdown
Capacity and redundancy
Breaker rating after the selected derate.
Average real load per available outlet.
Stress current if redundant load collapses to one side.
Reference voltage for wye-connected outlets.
208Y/120 V rack PDU
6 to 17 kVACommon North American three-phase rack feed with C13/C19 outlets and line-neutral outlet groups.400Y/230 V IEC PDU
11 to 22 kVAEfficient international rack distribution where each outlet can receive around 230 V line-neutral.415Y/240 V high-density
11 to 23 kVAOften used for dense IT racks because server PSUs run efficiently at higher input voltage.480 V facility feed
17 kVA+Usually stepped or distributed through facility gear before rack outlet presentation.| Output | Formula used | Best input source | Planning note |
|---|---|---|---|
| Real power | kW = phase A + phase B + phase C | Metered outlet groups or branch meters | Real power is the load that becomes heat in the rack space. |
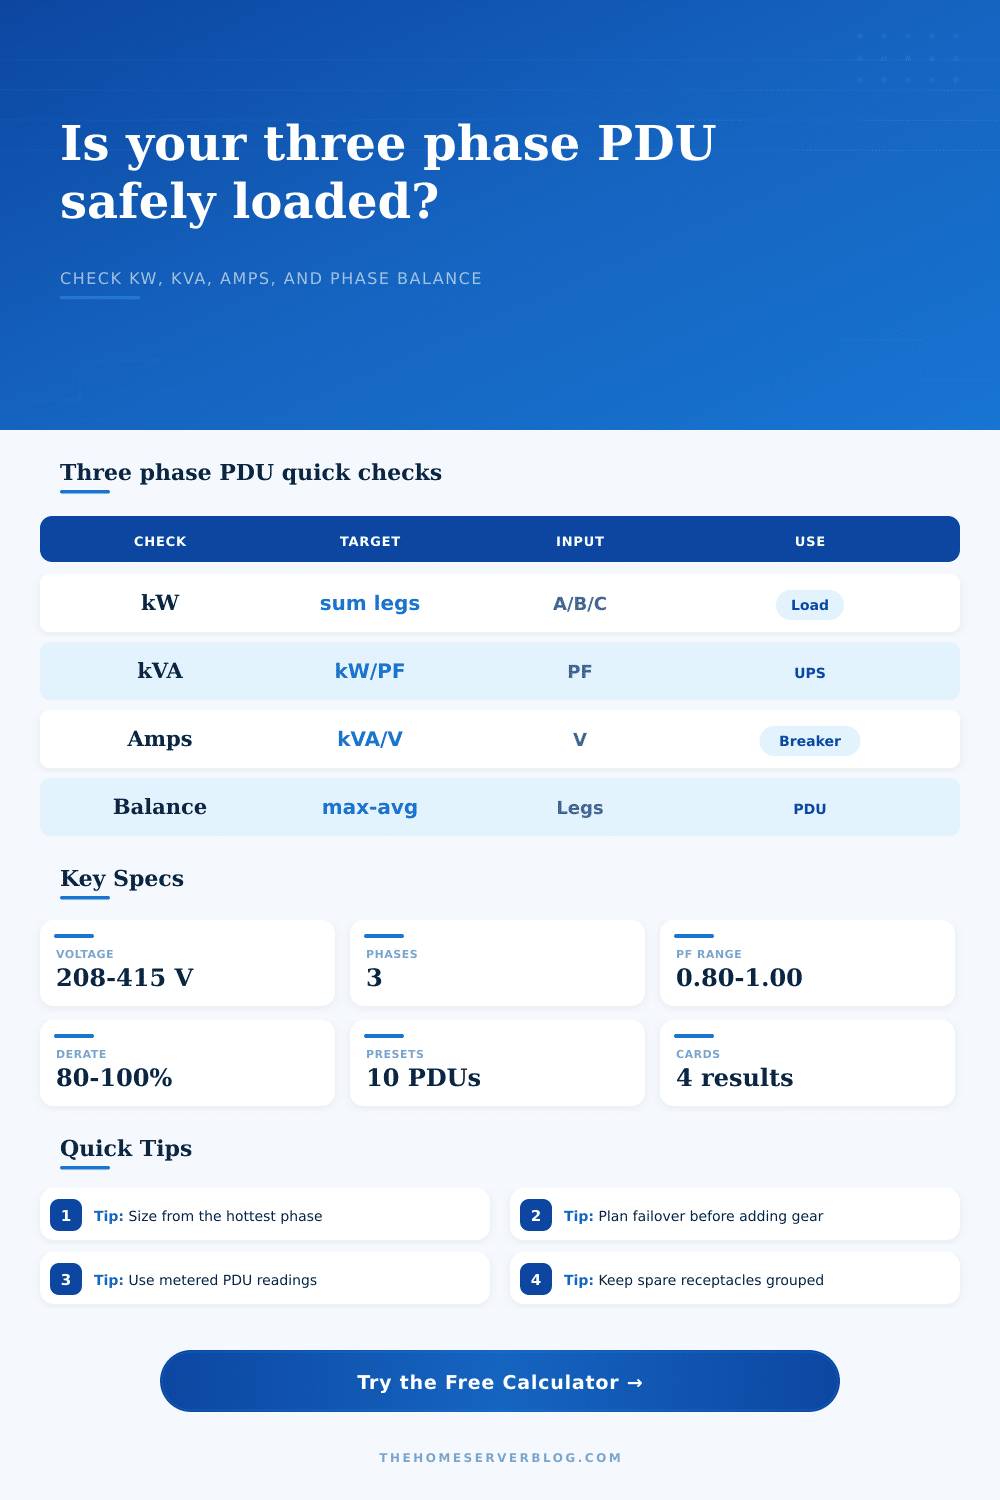
| Apparent power | kVA = kW / power factor | Meter PF or UPS report | UPS and PDU limits may be stated in kVA and amps. |
| Three-phase current | A = kVA x 1000 / (1.732 x VLL) | Line-to-line voltage | Compare calculated amps with the highest measured PDU phase. |
| Continuous capacity | A usable = breaker amps x derate | Breaker and site rule | Use continuous capacity for always-on server loads. |
| PDU feed | 20 A at 80 percent | 30 A at 80 percent | 60 A at 80 percent |
|---|---|---|---|
| 208 V three-phase | 5.8 kVA | 8.6 kVA | 17.3 kVA |
| 240 V delta | 6.7 kVA | 10.0 kVA | 19.9 kVA |
| 400 V three-phase | 11.1 kVA | 16.6 kVA | 33.3 kVA |
| 415 V three-phase | 11.5 kVA | 17.3 kVA | 34.5 kVA |
| Imbalance band | What it means | Typical action | Risk to watch |
|---|---|---|---|
| 0 to 5 percent | Very even phase loading | Keep the same outlet grouping plan | Low neutral and feeder stress |
| 5 to 10 percent | Normal mixed rack variation | Place the next server on the lightest phase | Small headroom loss on one leg |
| 10 to 20 percent | Uneven receptacle group loading | Move dual-cord loads or PDUs by phase group | One phase may trip before total kW looks high |
| 20 percent+ | High imbalance for dense IT load | Re-map outlets and confirm with meter readings | Thermal and breaker margin can disappear quickly |
| Mode | Normal design target | Failover check | Outlet planning cue |
|---|---|---|---|
| Single three-phase PDU | Use derate x utilization target | No alternate feed in this model | Keep spare outlets across all phase groups |
| A/B pair at 50 percent | Each PDU carries about half the rack | One PDU may carry the full rack after a feed loss | Split dual-cord devices evenly by phase |
| A/B pair at 66 percent | Higher normal density with less failover margin | Failover can exceed the normal target quickly | Reserve outlets for the lightest phase first |
| 2N rack design | Each side must be sized for full load | Either side carries the rack alone | Mirror outlet groups between A and B feeds |
Looking into a server rack may only reveal blinking lights. Behind closed doors, heat accumulate and current climbs to trip a breaker. Yet there’s an electric tension between this visual calm and the electrical stress that can brings down data center projects. Your power distribution unit may be struggling to deal with an unbalanced load while your quiet row of server hum along.
Enter the line voltage and breaker rating into the calculator; it will do the math for you. But what does that number mean? Current flows (that’s why we call it current) and creates heat and risk. Potential means voltage, simply the “potential” for current to flow. Your system boundaries is determined by the line voltage and breaker rating that you enter. The tool then reveals how much of that boundary you’re using.
Why Balanced Power is Important for Servers
The biggest no-no is relying on average load. Your three-phase system appear balanced in theory. However, if you put a heavy GPU in leg A and nothing in leg C, the hottest leg control safety. It’s easy to look at average load, split total power by three and assume “it’s OK.” One of those phases are maxed out, though, so why overlook that?
Check for imbalance. Uneven legs mean you’re effectively operating a single phase with triple the infrastructure cost. Small imbalances (see reference table) cut your capacity, to. Ten percent may not sound like much but half a leg handles double the work. That becomes critical if a UPS kicks over during a storm.
There’s also hidden danger in power factor, which is how well you are using electricity. Cheap power supplies found on old equipment tend to have poor power factors; they draw much more current then the amount actualy doing work. The calculator asks for this number so it can separate real power from apparent power. Without paying attention to this figure, you could believe that you have room remaining on your ammeter when really you’ve hit your kVA limit. This means you’ve overloaded the circuit with reactive load and caused your PDU to trip, not due to excessive wattage consumption. Moddern IT gear is typically designed for a power factor around 0.9, while older systems can pull it lower. Check it with a meter rather than guess by looking at nameplate specs.
That all changes when you start adding redundancy. When you have just one feed, it’s just you and your breaker protecting you. On an A/B redundant pair of feed, however, things gets tricky. You want to make sure you can handle the worst case scenario. What happens when you max out both PDUs? What if one fails and the other has to pick up the slack immediately? That should of not happen. So what do you do?
Derate your capacity. Based off how much redundancy you choose to run, the tool reduces how much you think you can use. It makes you admit that running in redundant mode means you’ll be able to carry less of a load while not redundant. It seems wasteful. But a system that never goes down isn’t really efficient anyway. Resilience costs peak capacity.
Heat is just another form of wasted electricity. For every watt consumed by a computer, one watt is converted to thermal energy inside your room. Your air conditioning bills is based off an estimate of heat load output. At higher densities, your cooling systems runs at full bore like your servers. You have a closed loop: power-in/heat-out. Unbalanced electrical loads create hot spots, either damaging components, throttling performance, or both. You want a constant draw that doesn’t exceeds your breaker’s derated capacity.
Don’t wait until the lights go out to check your margins, measure the phases individually. Balance the legs. Check the imbalance. Measure each phase separately. Understand what the numbers mean about your setup. Don’t be afraid of leaving space for error. It’s better to have empty outlets than tripped breakers.
The danger is often in the quiet racks. And let the power factor get its due. The tool spits out numbers; it doesn’t tell you what those numbers mean. You need to understand that.